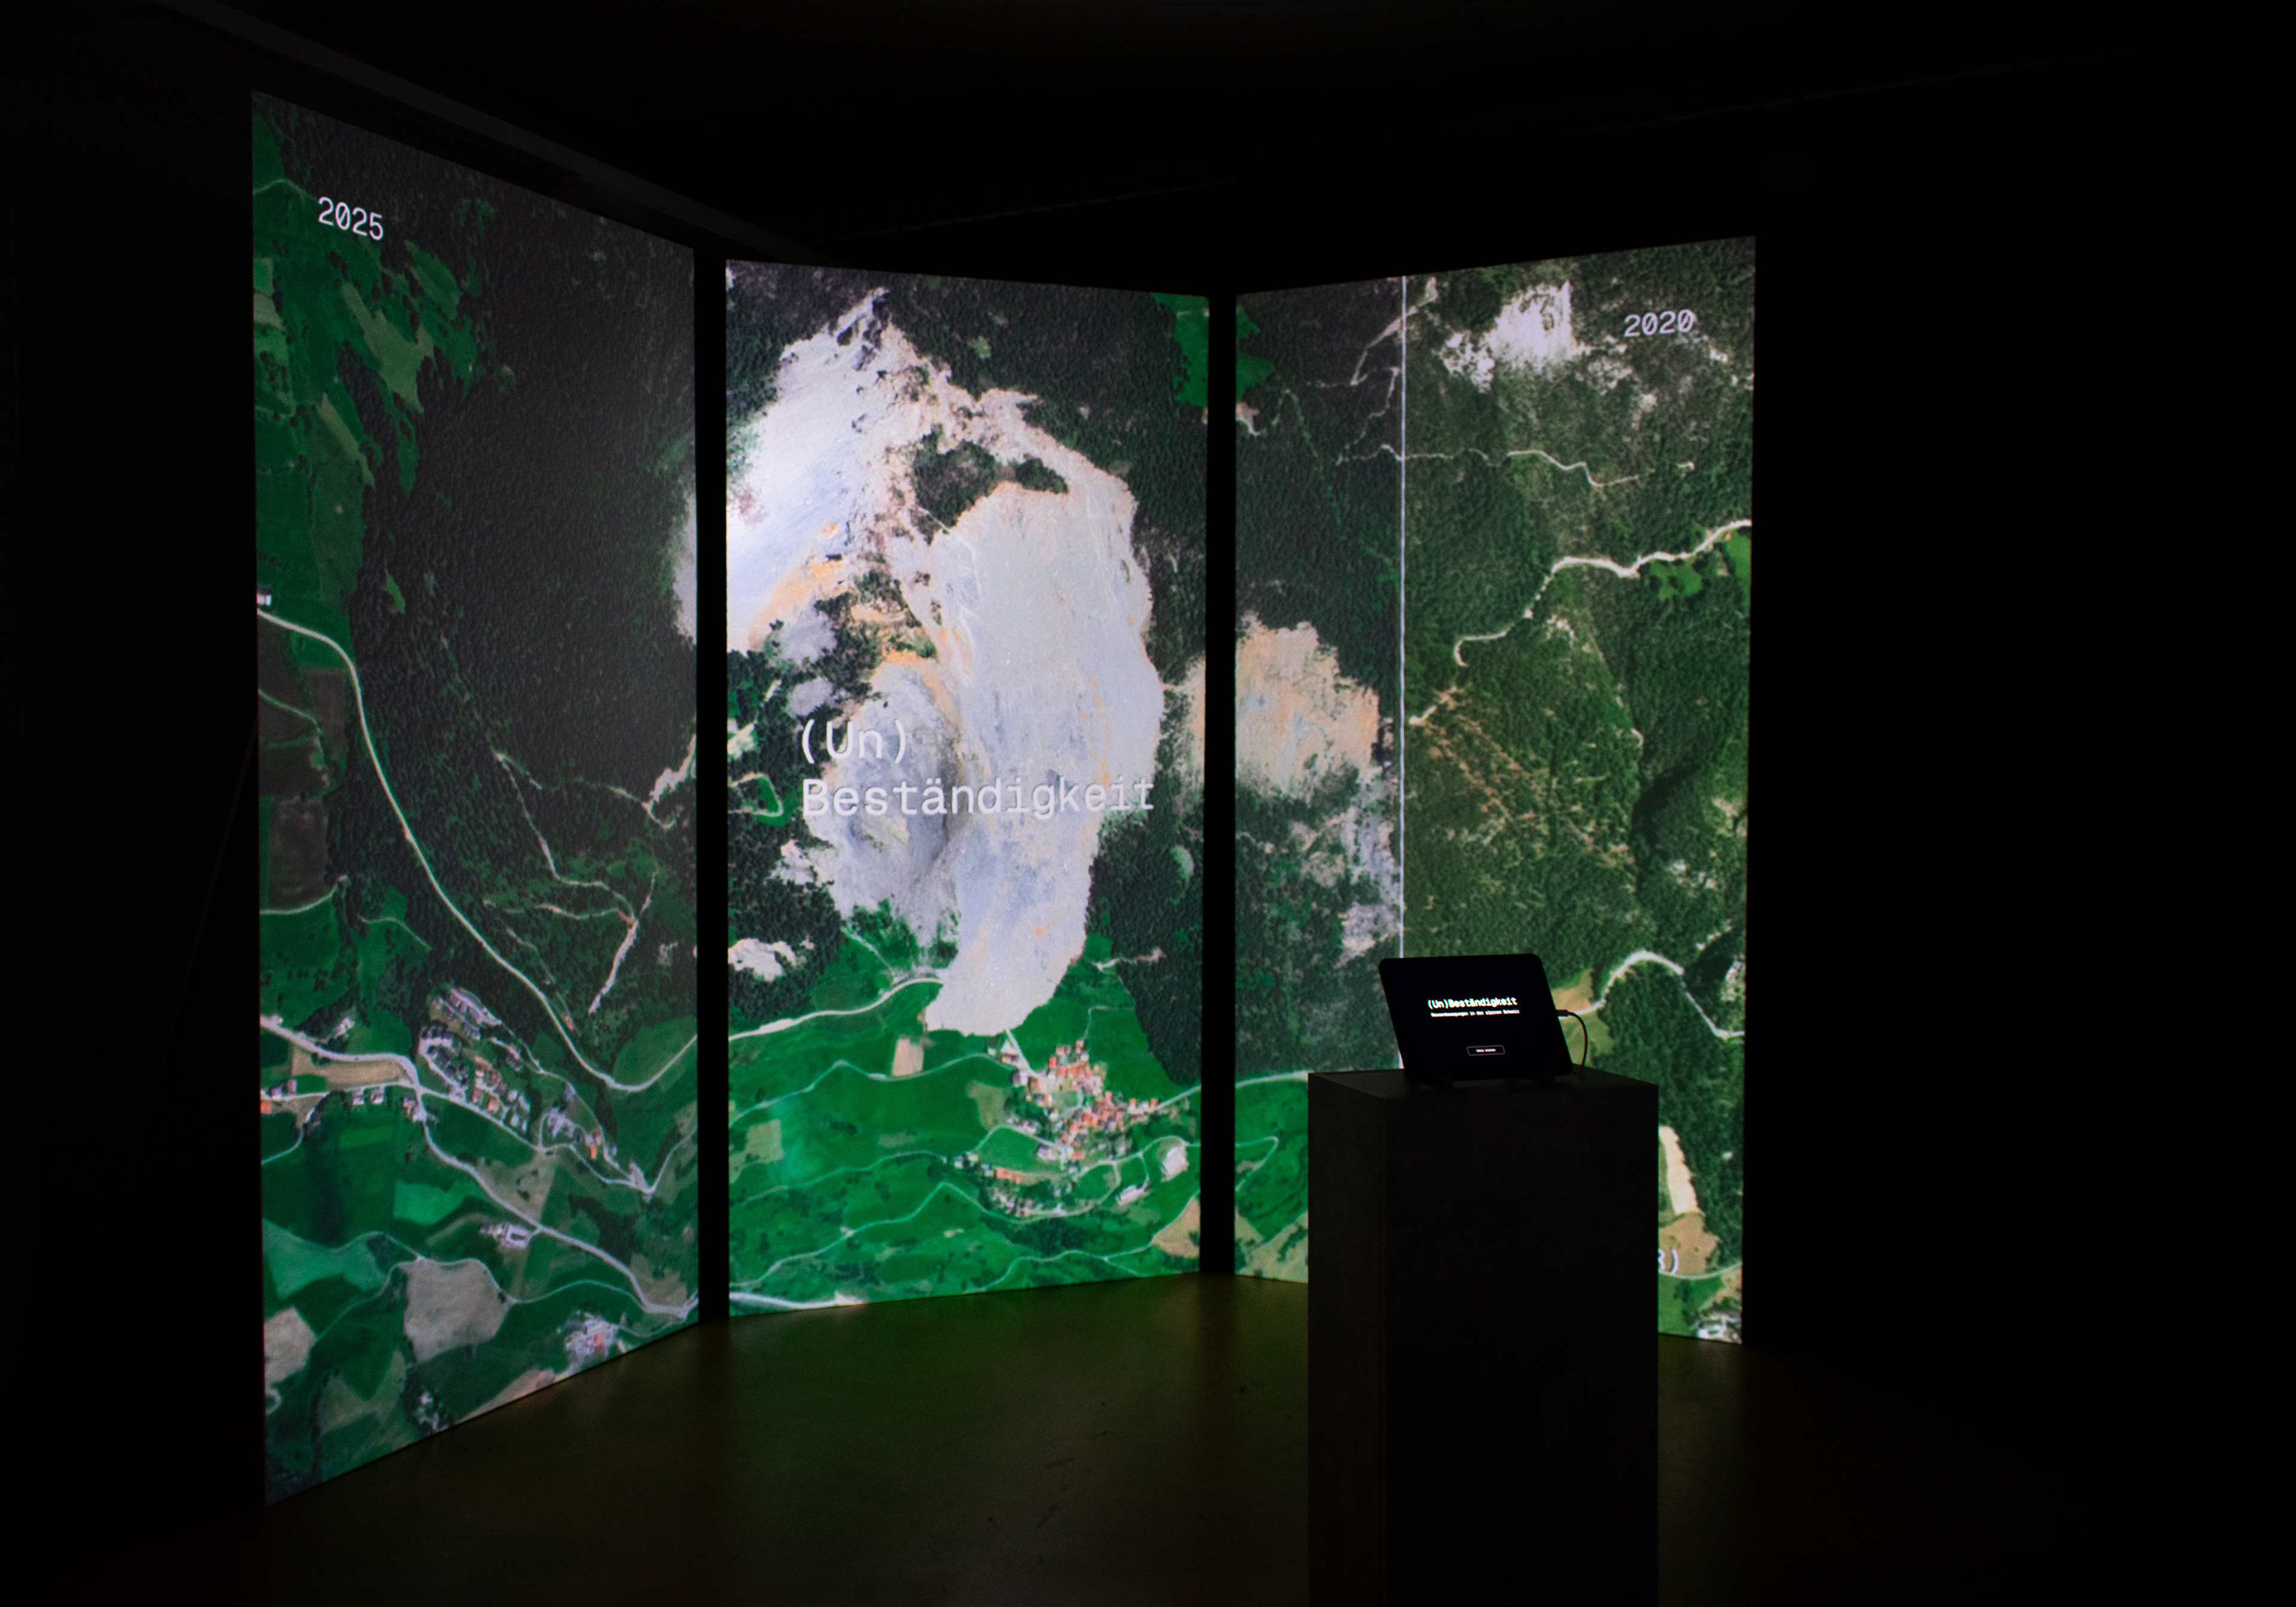
Title screen of the installation: A swipe that reveals the landscape change in Brienz (GR) from the years 2020 to 2025.
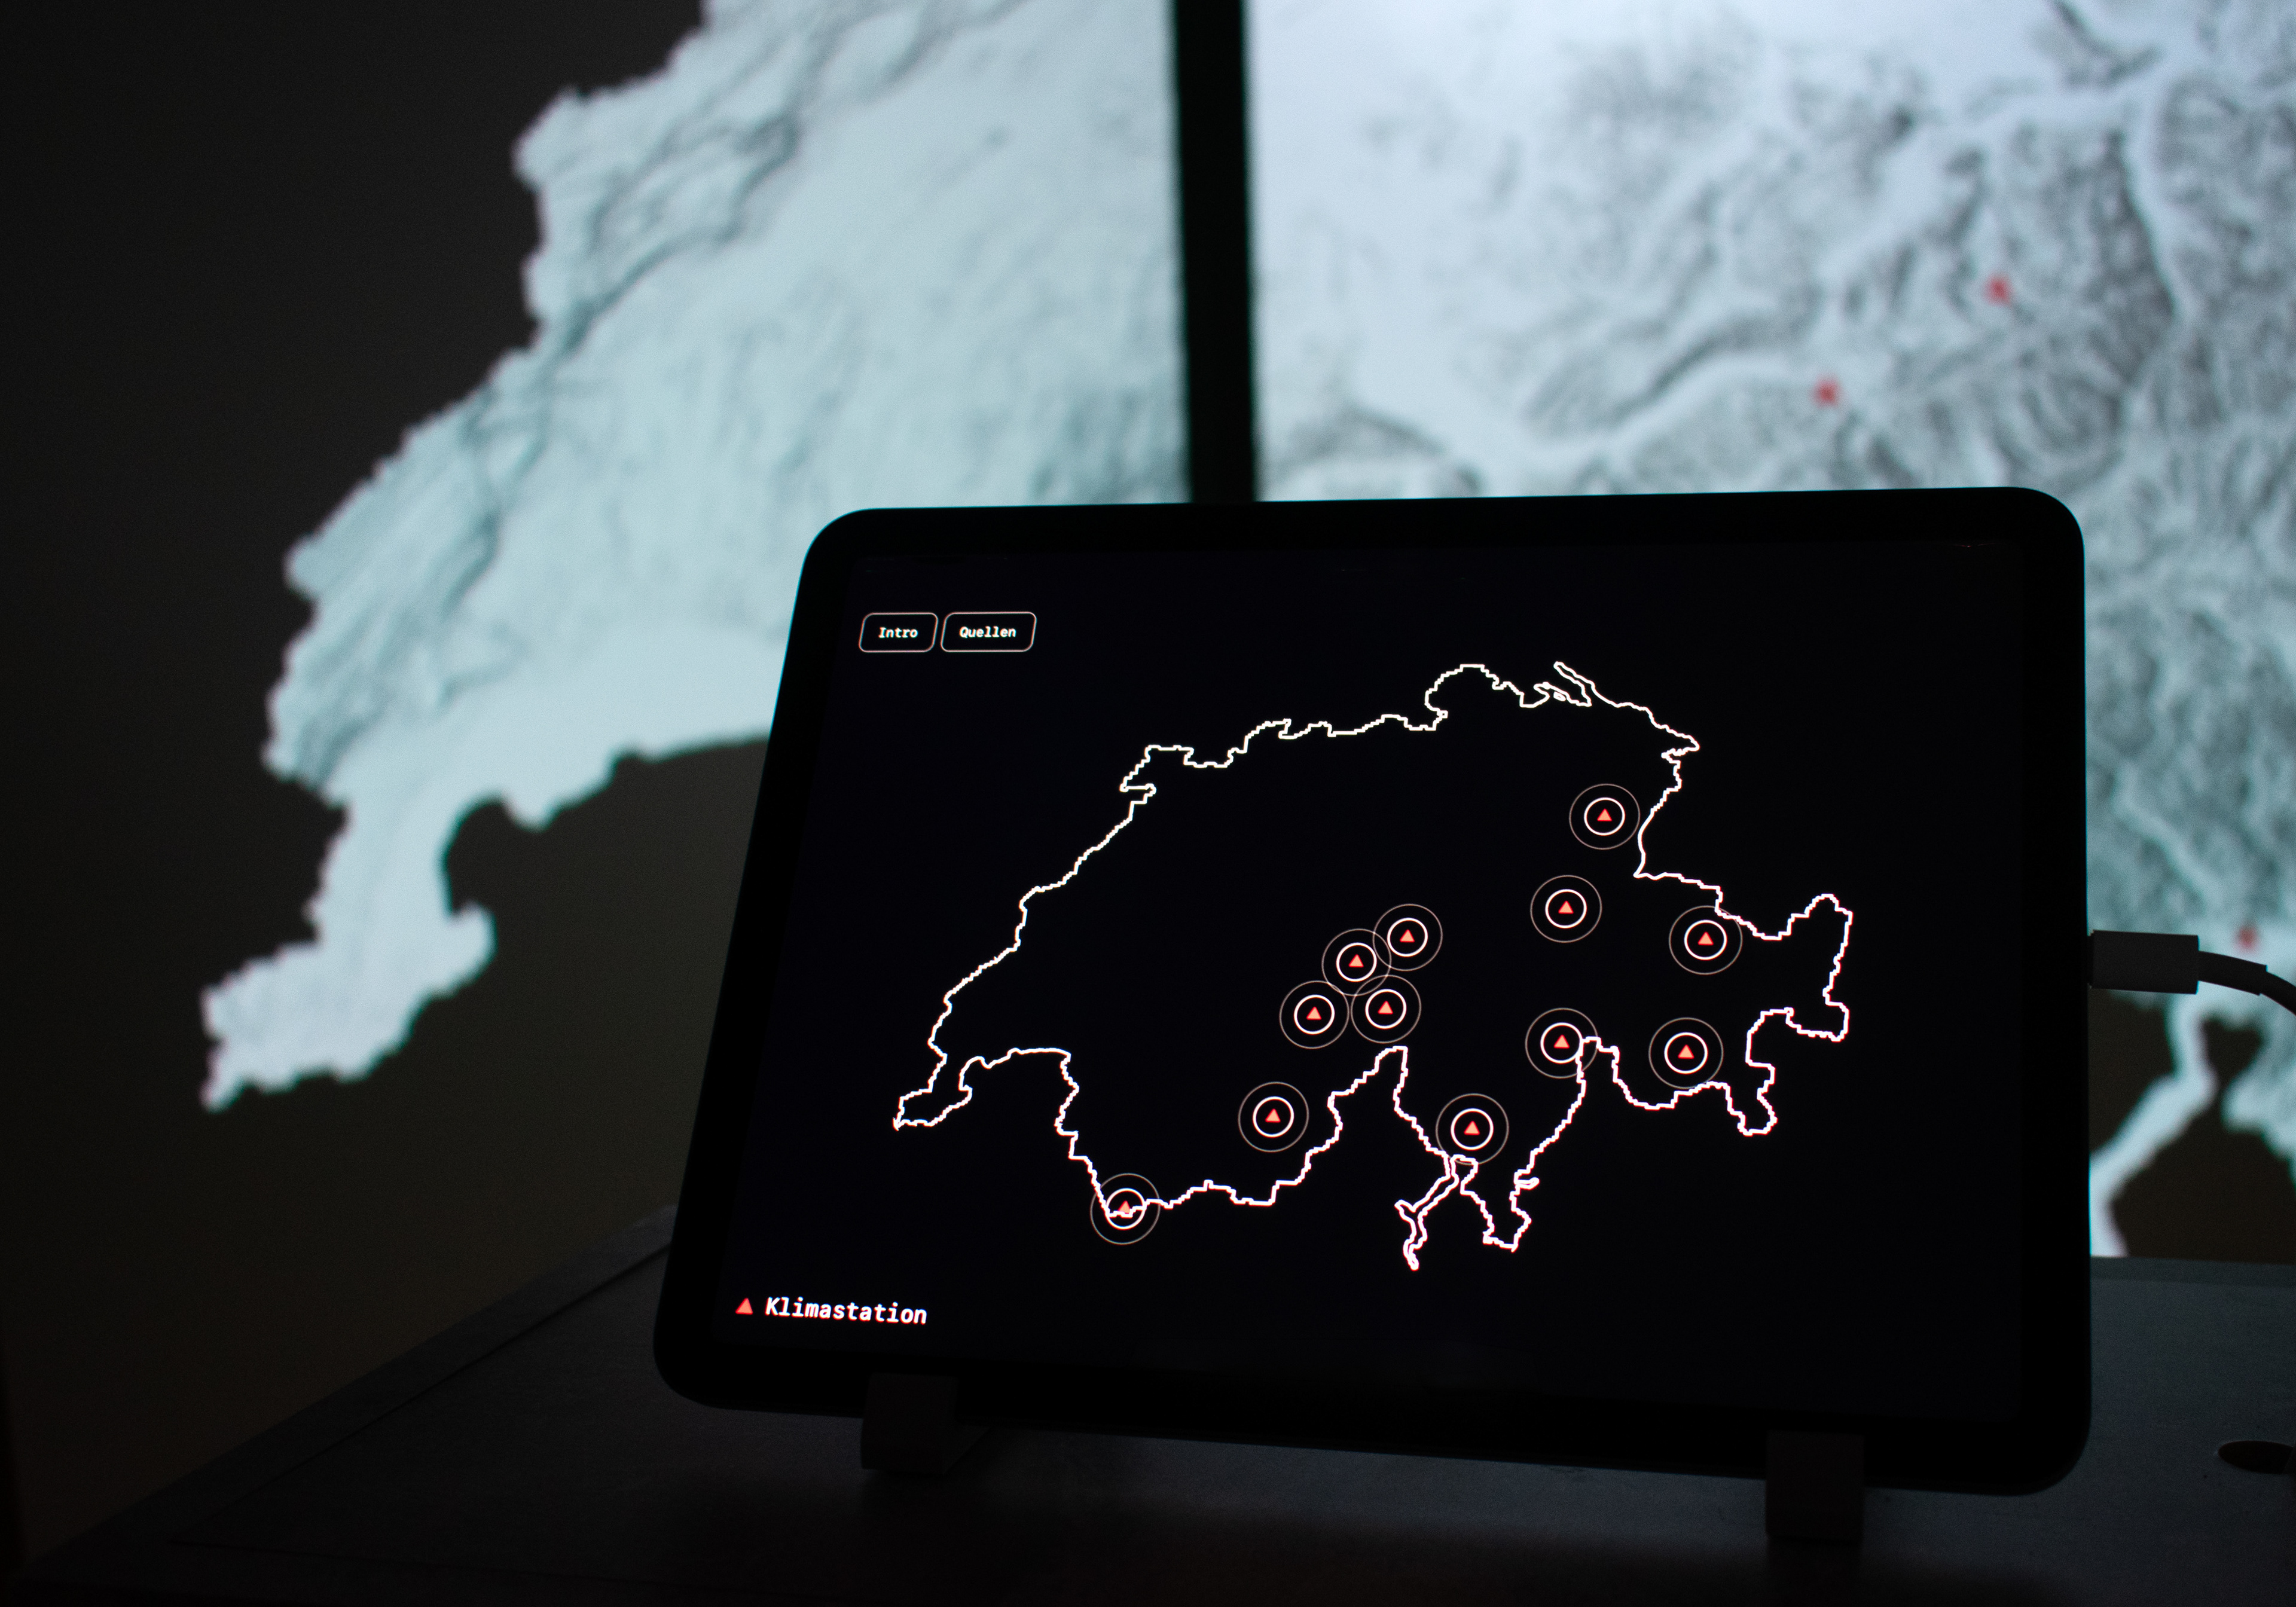
The iPad works as a controller. Information in form of text is mainly displayed on the iPad.
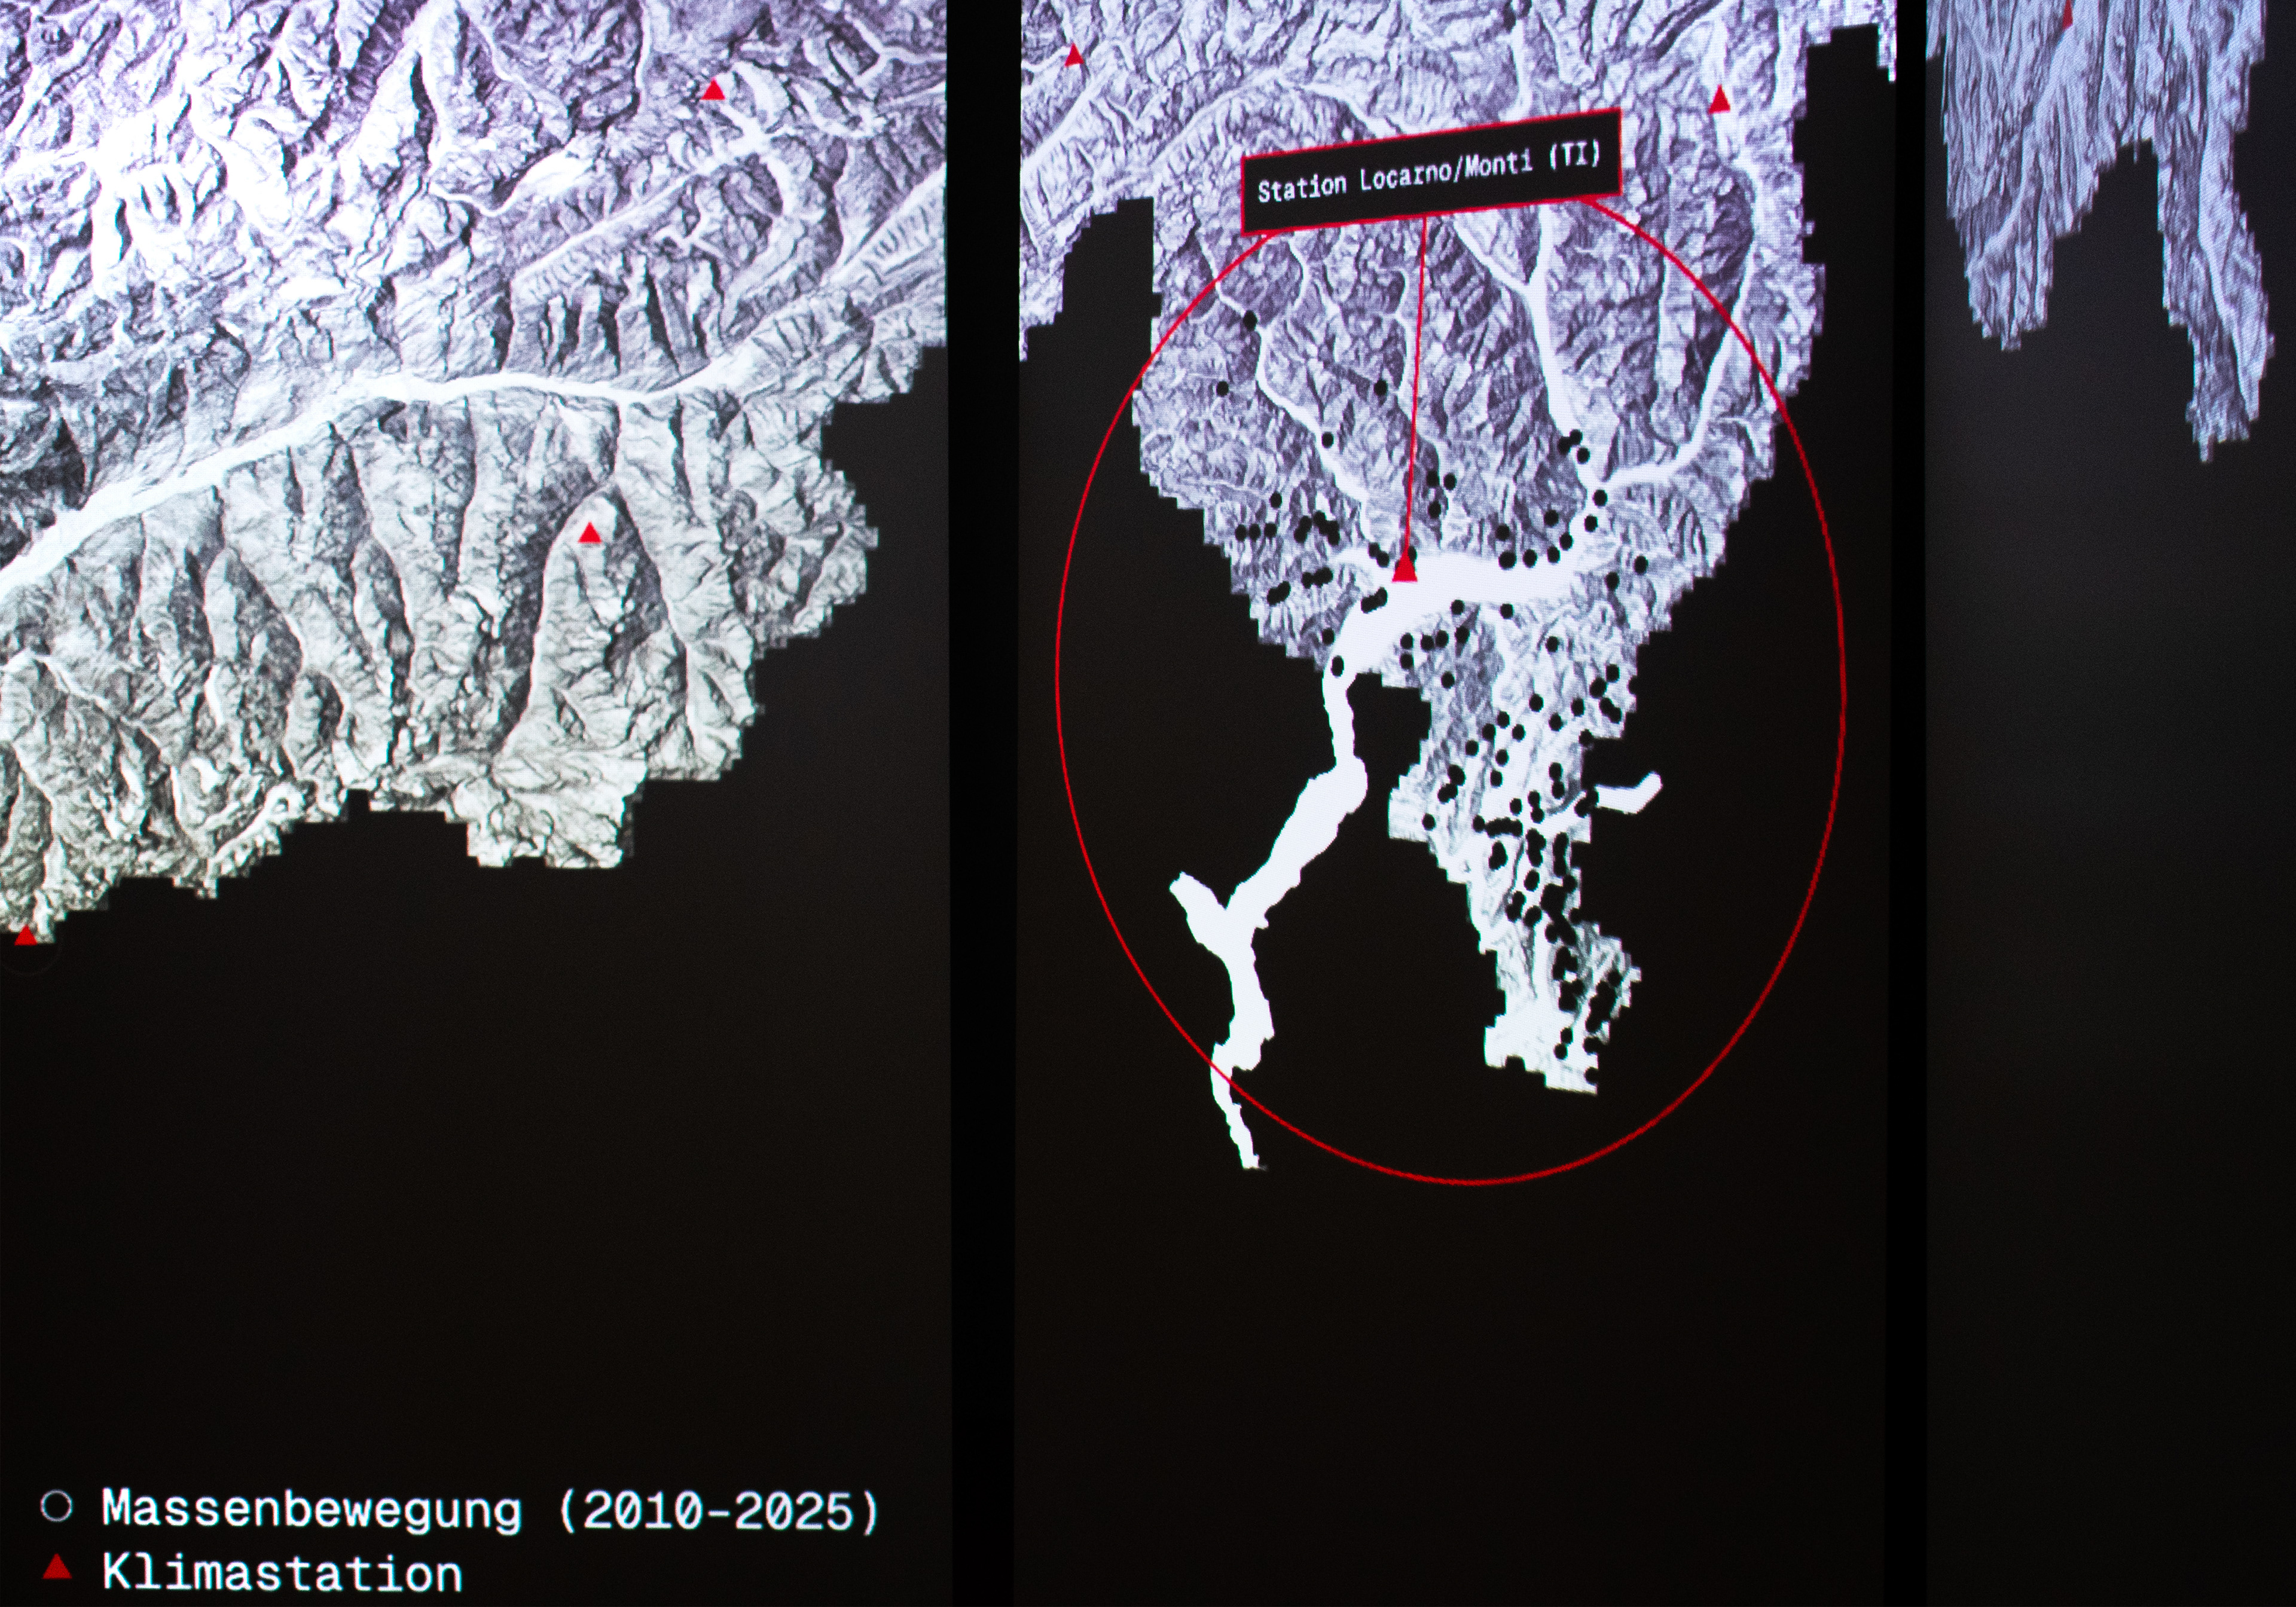
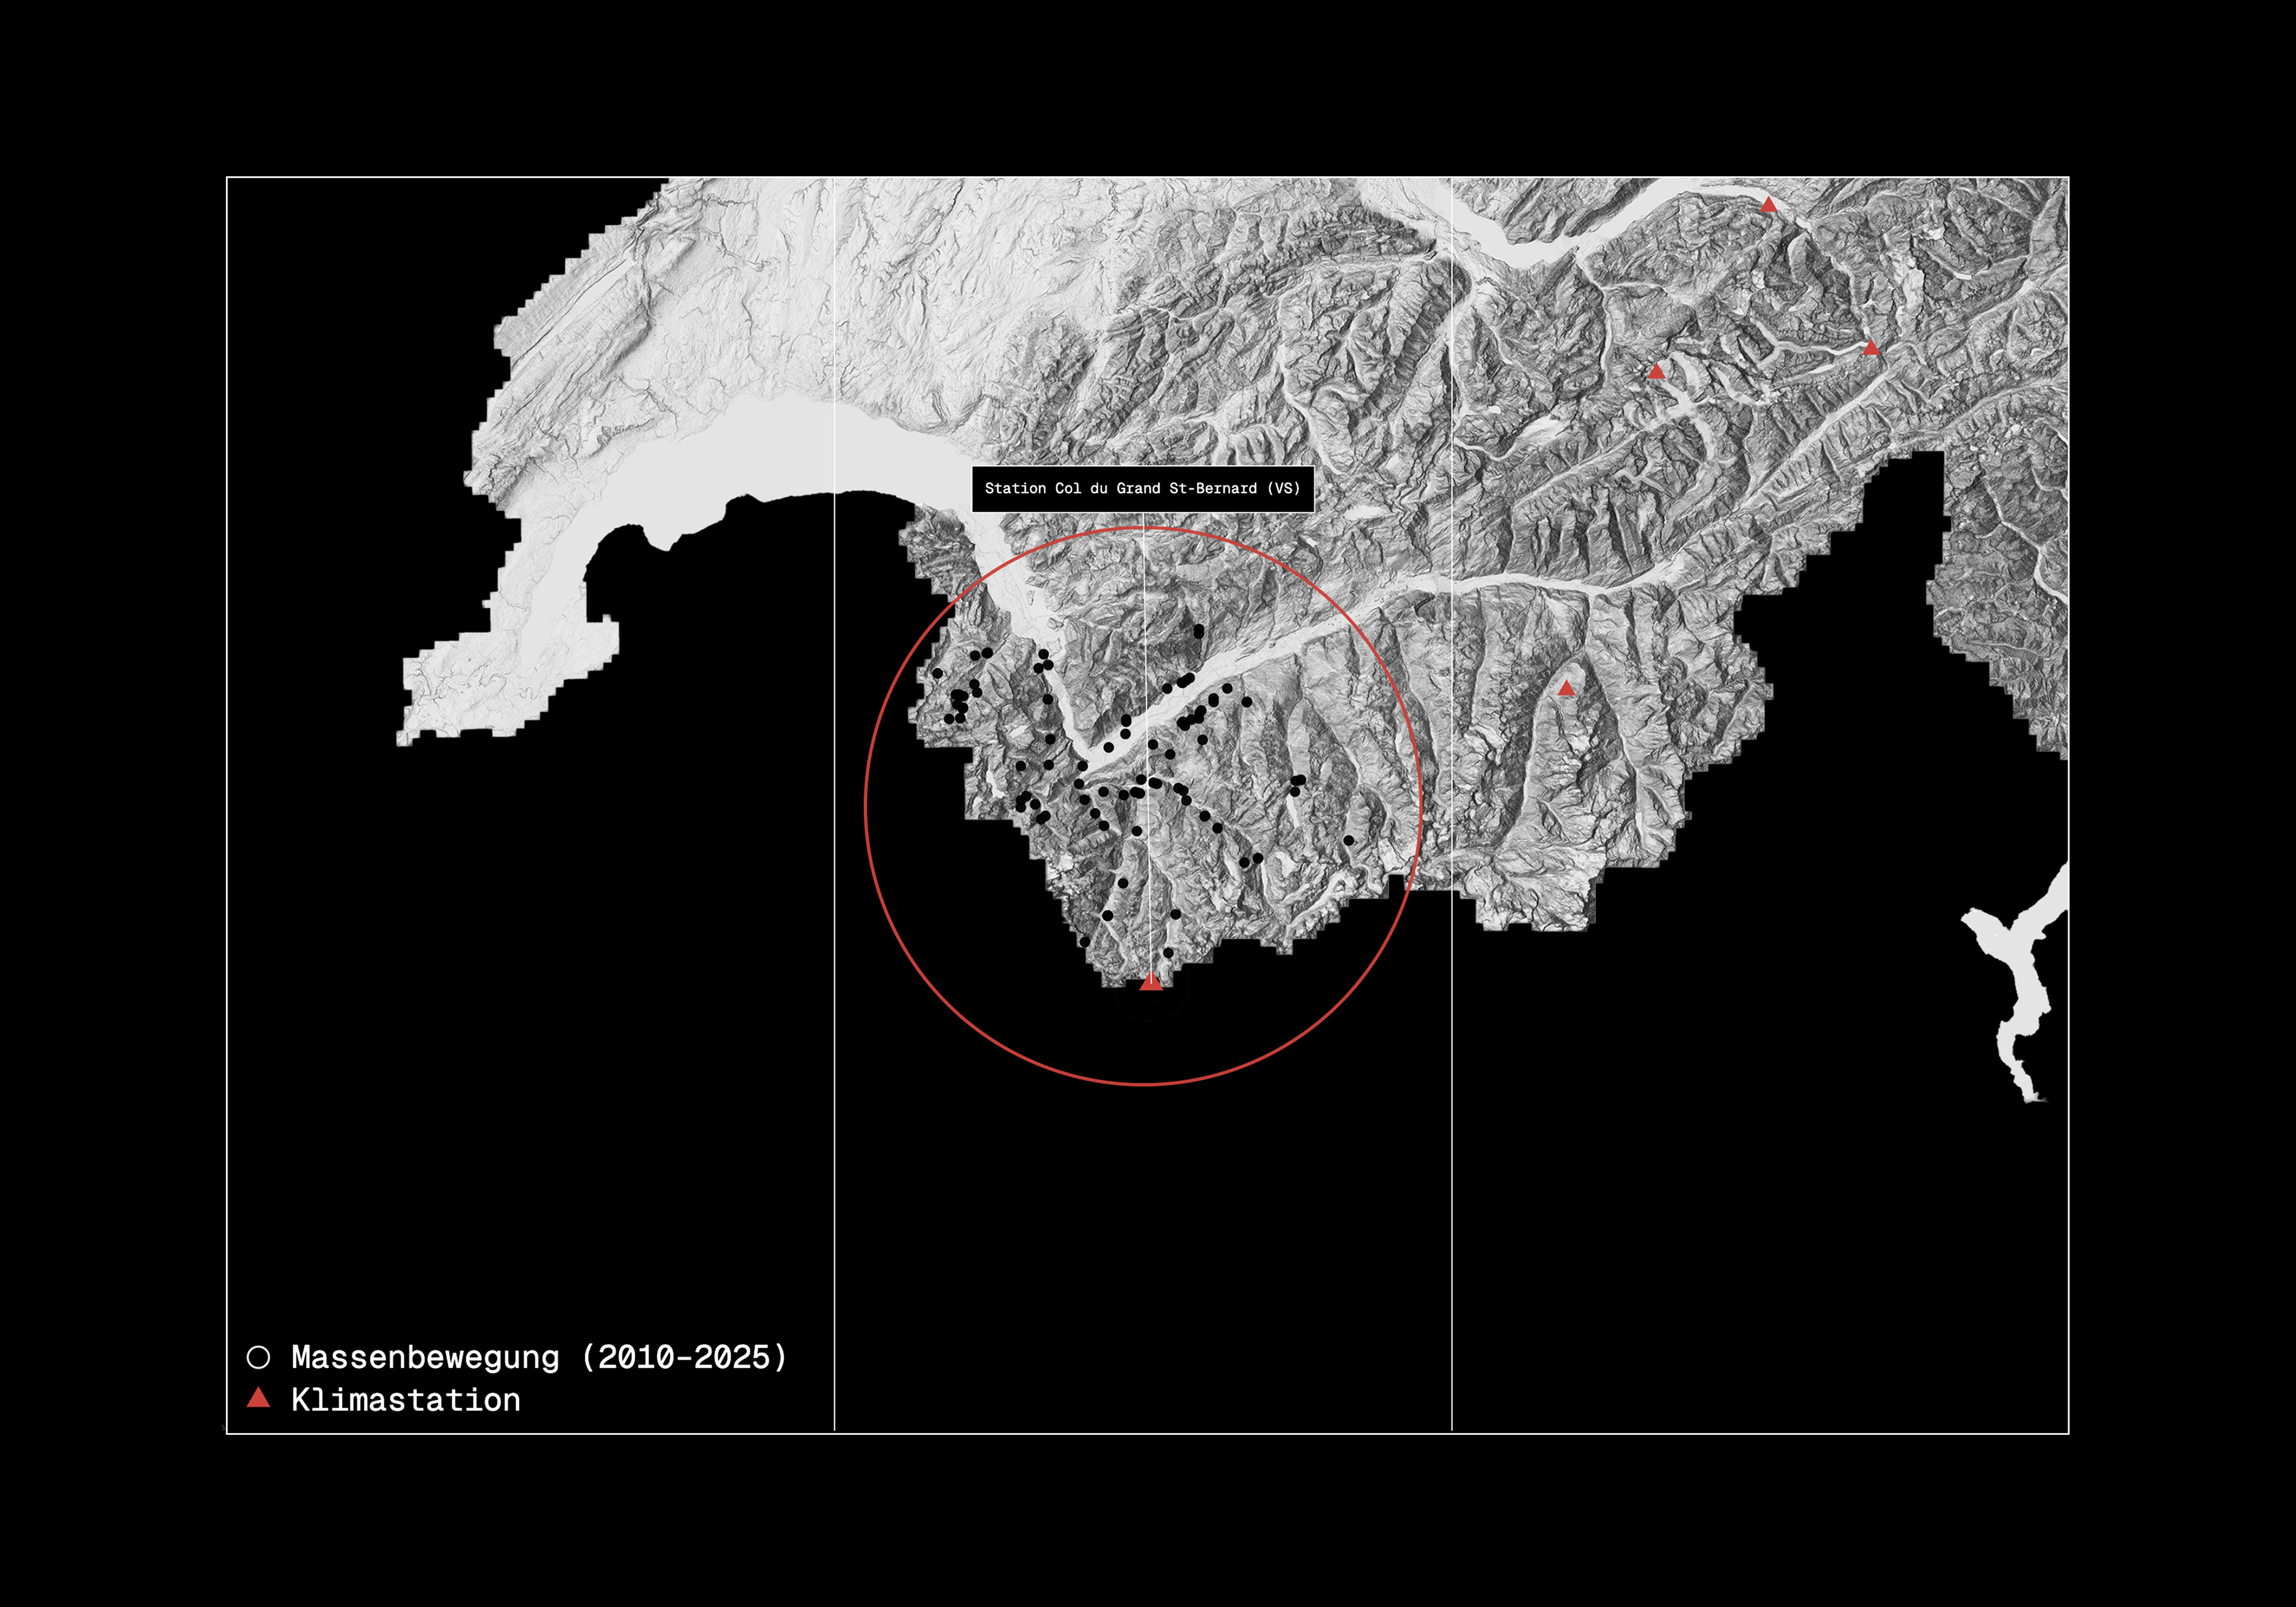
A selected station and its defined area.
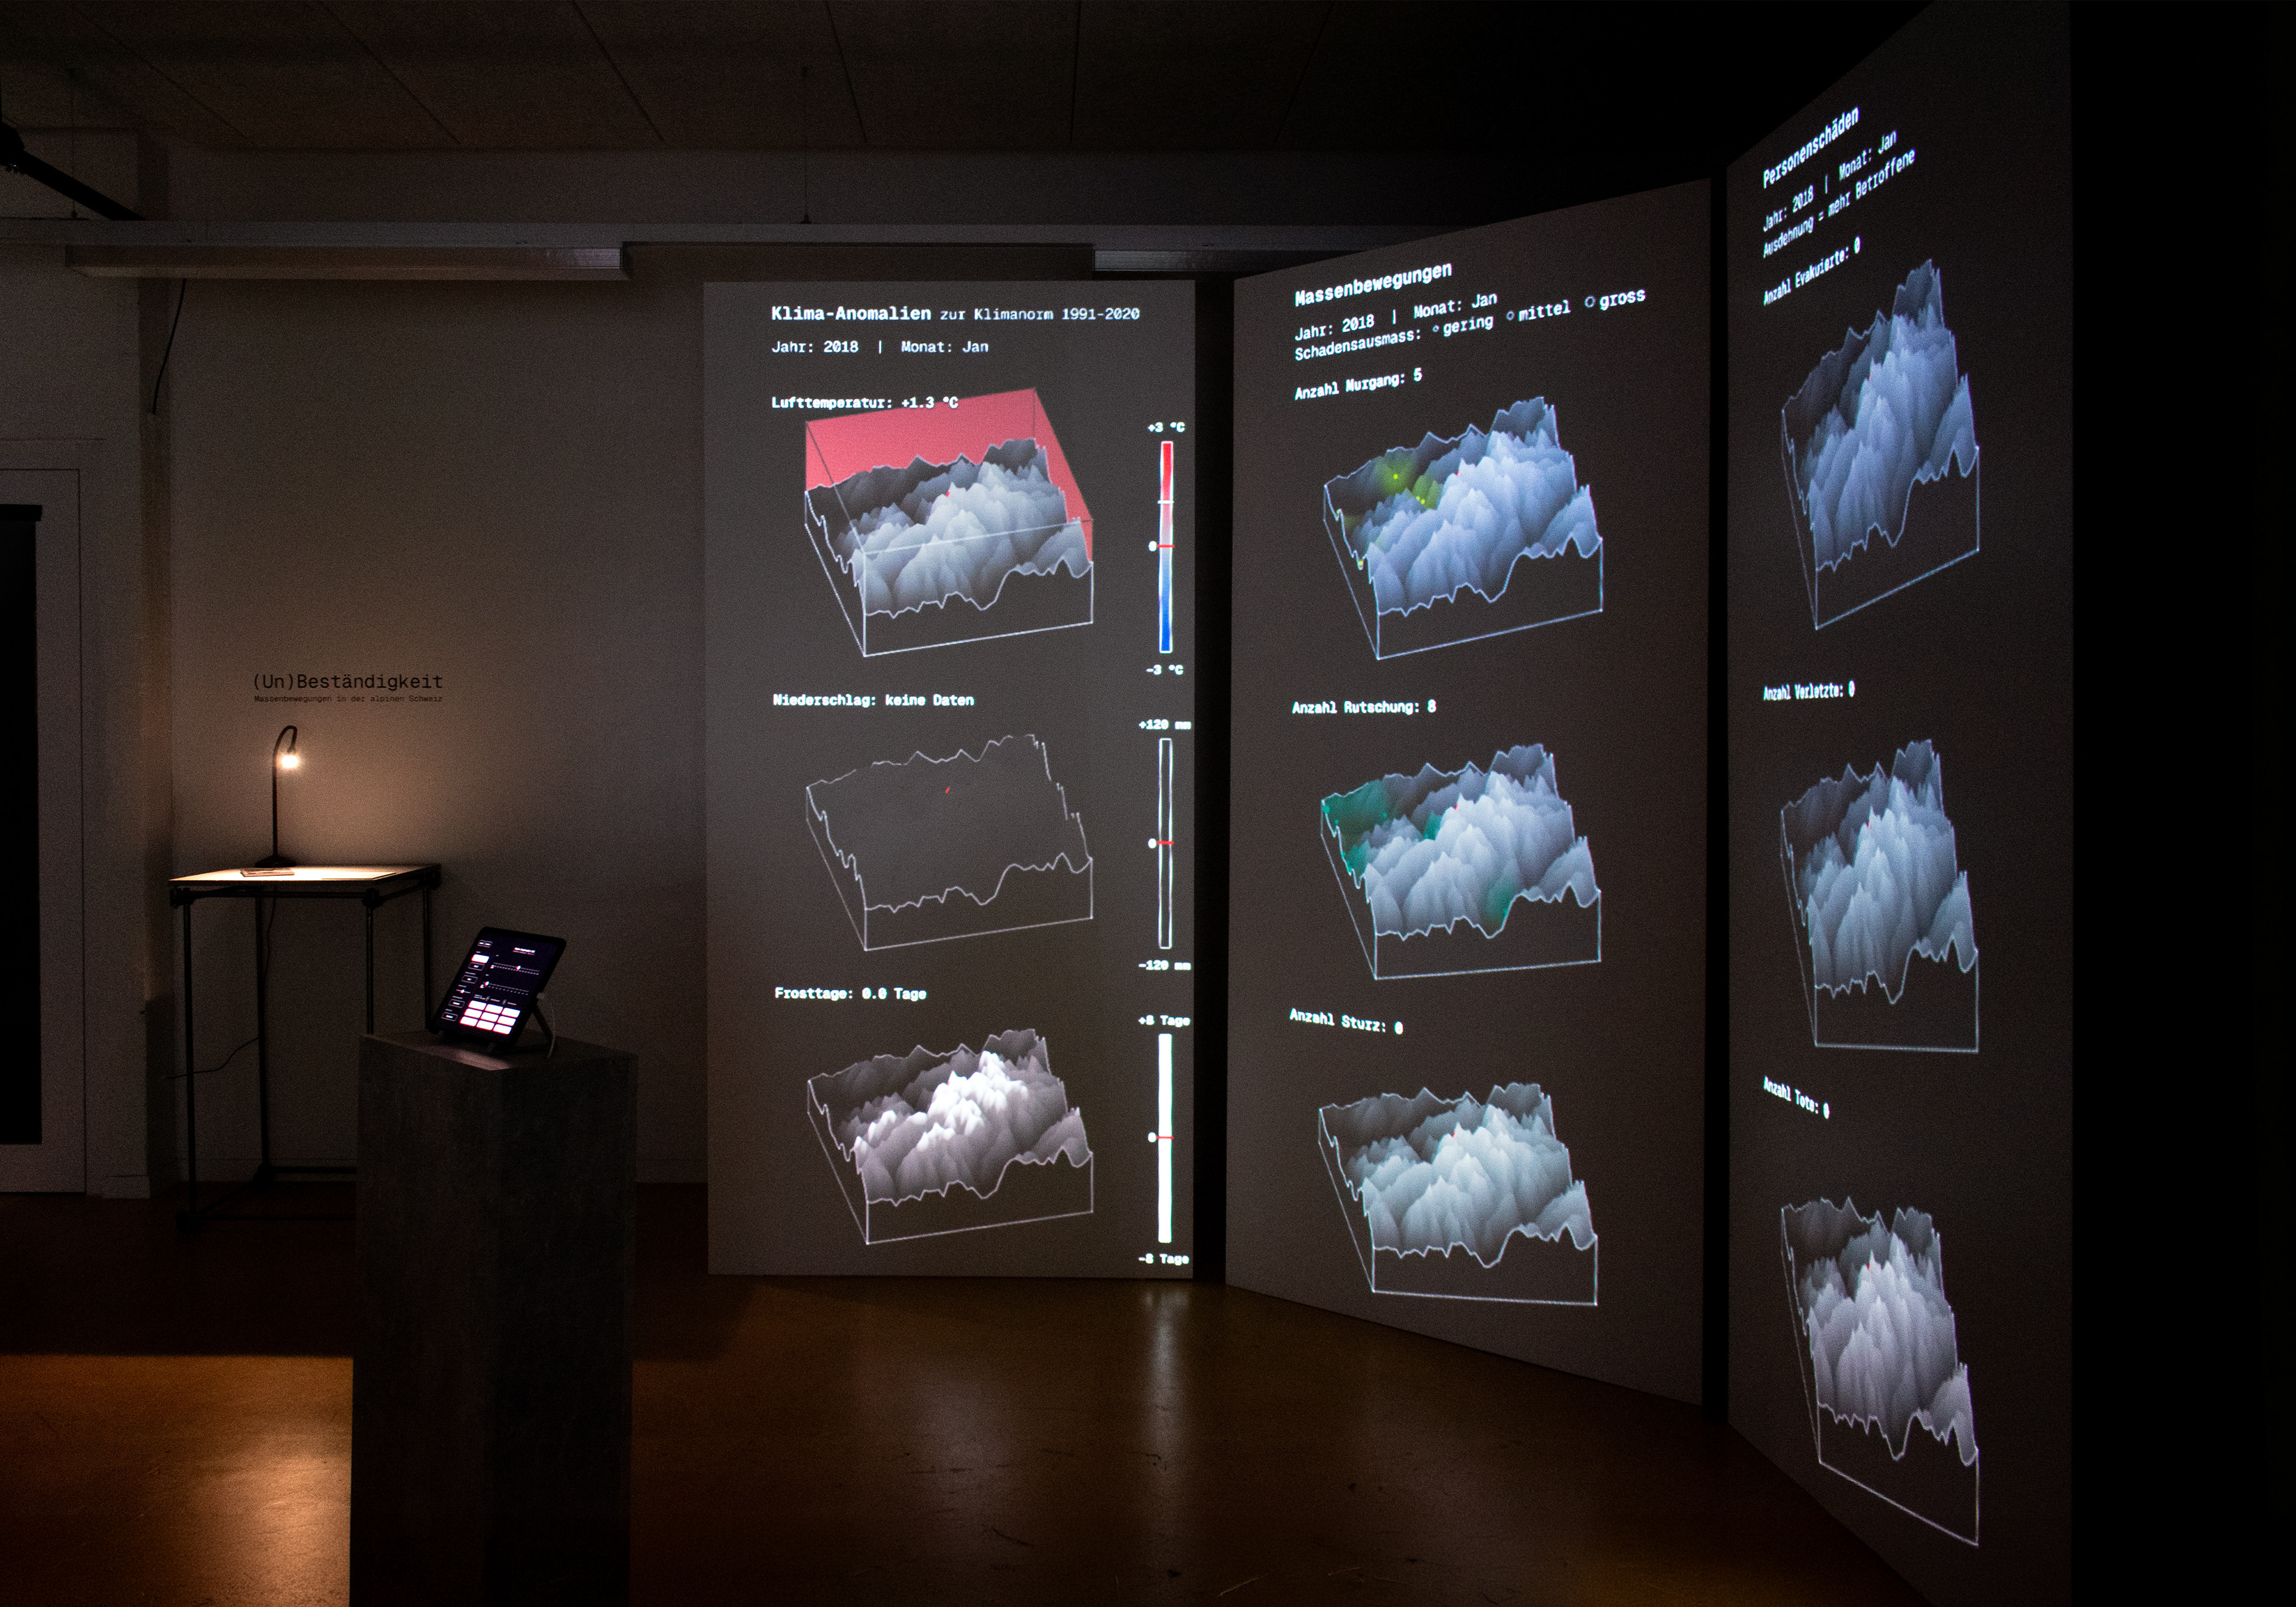
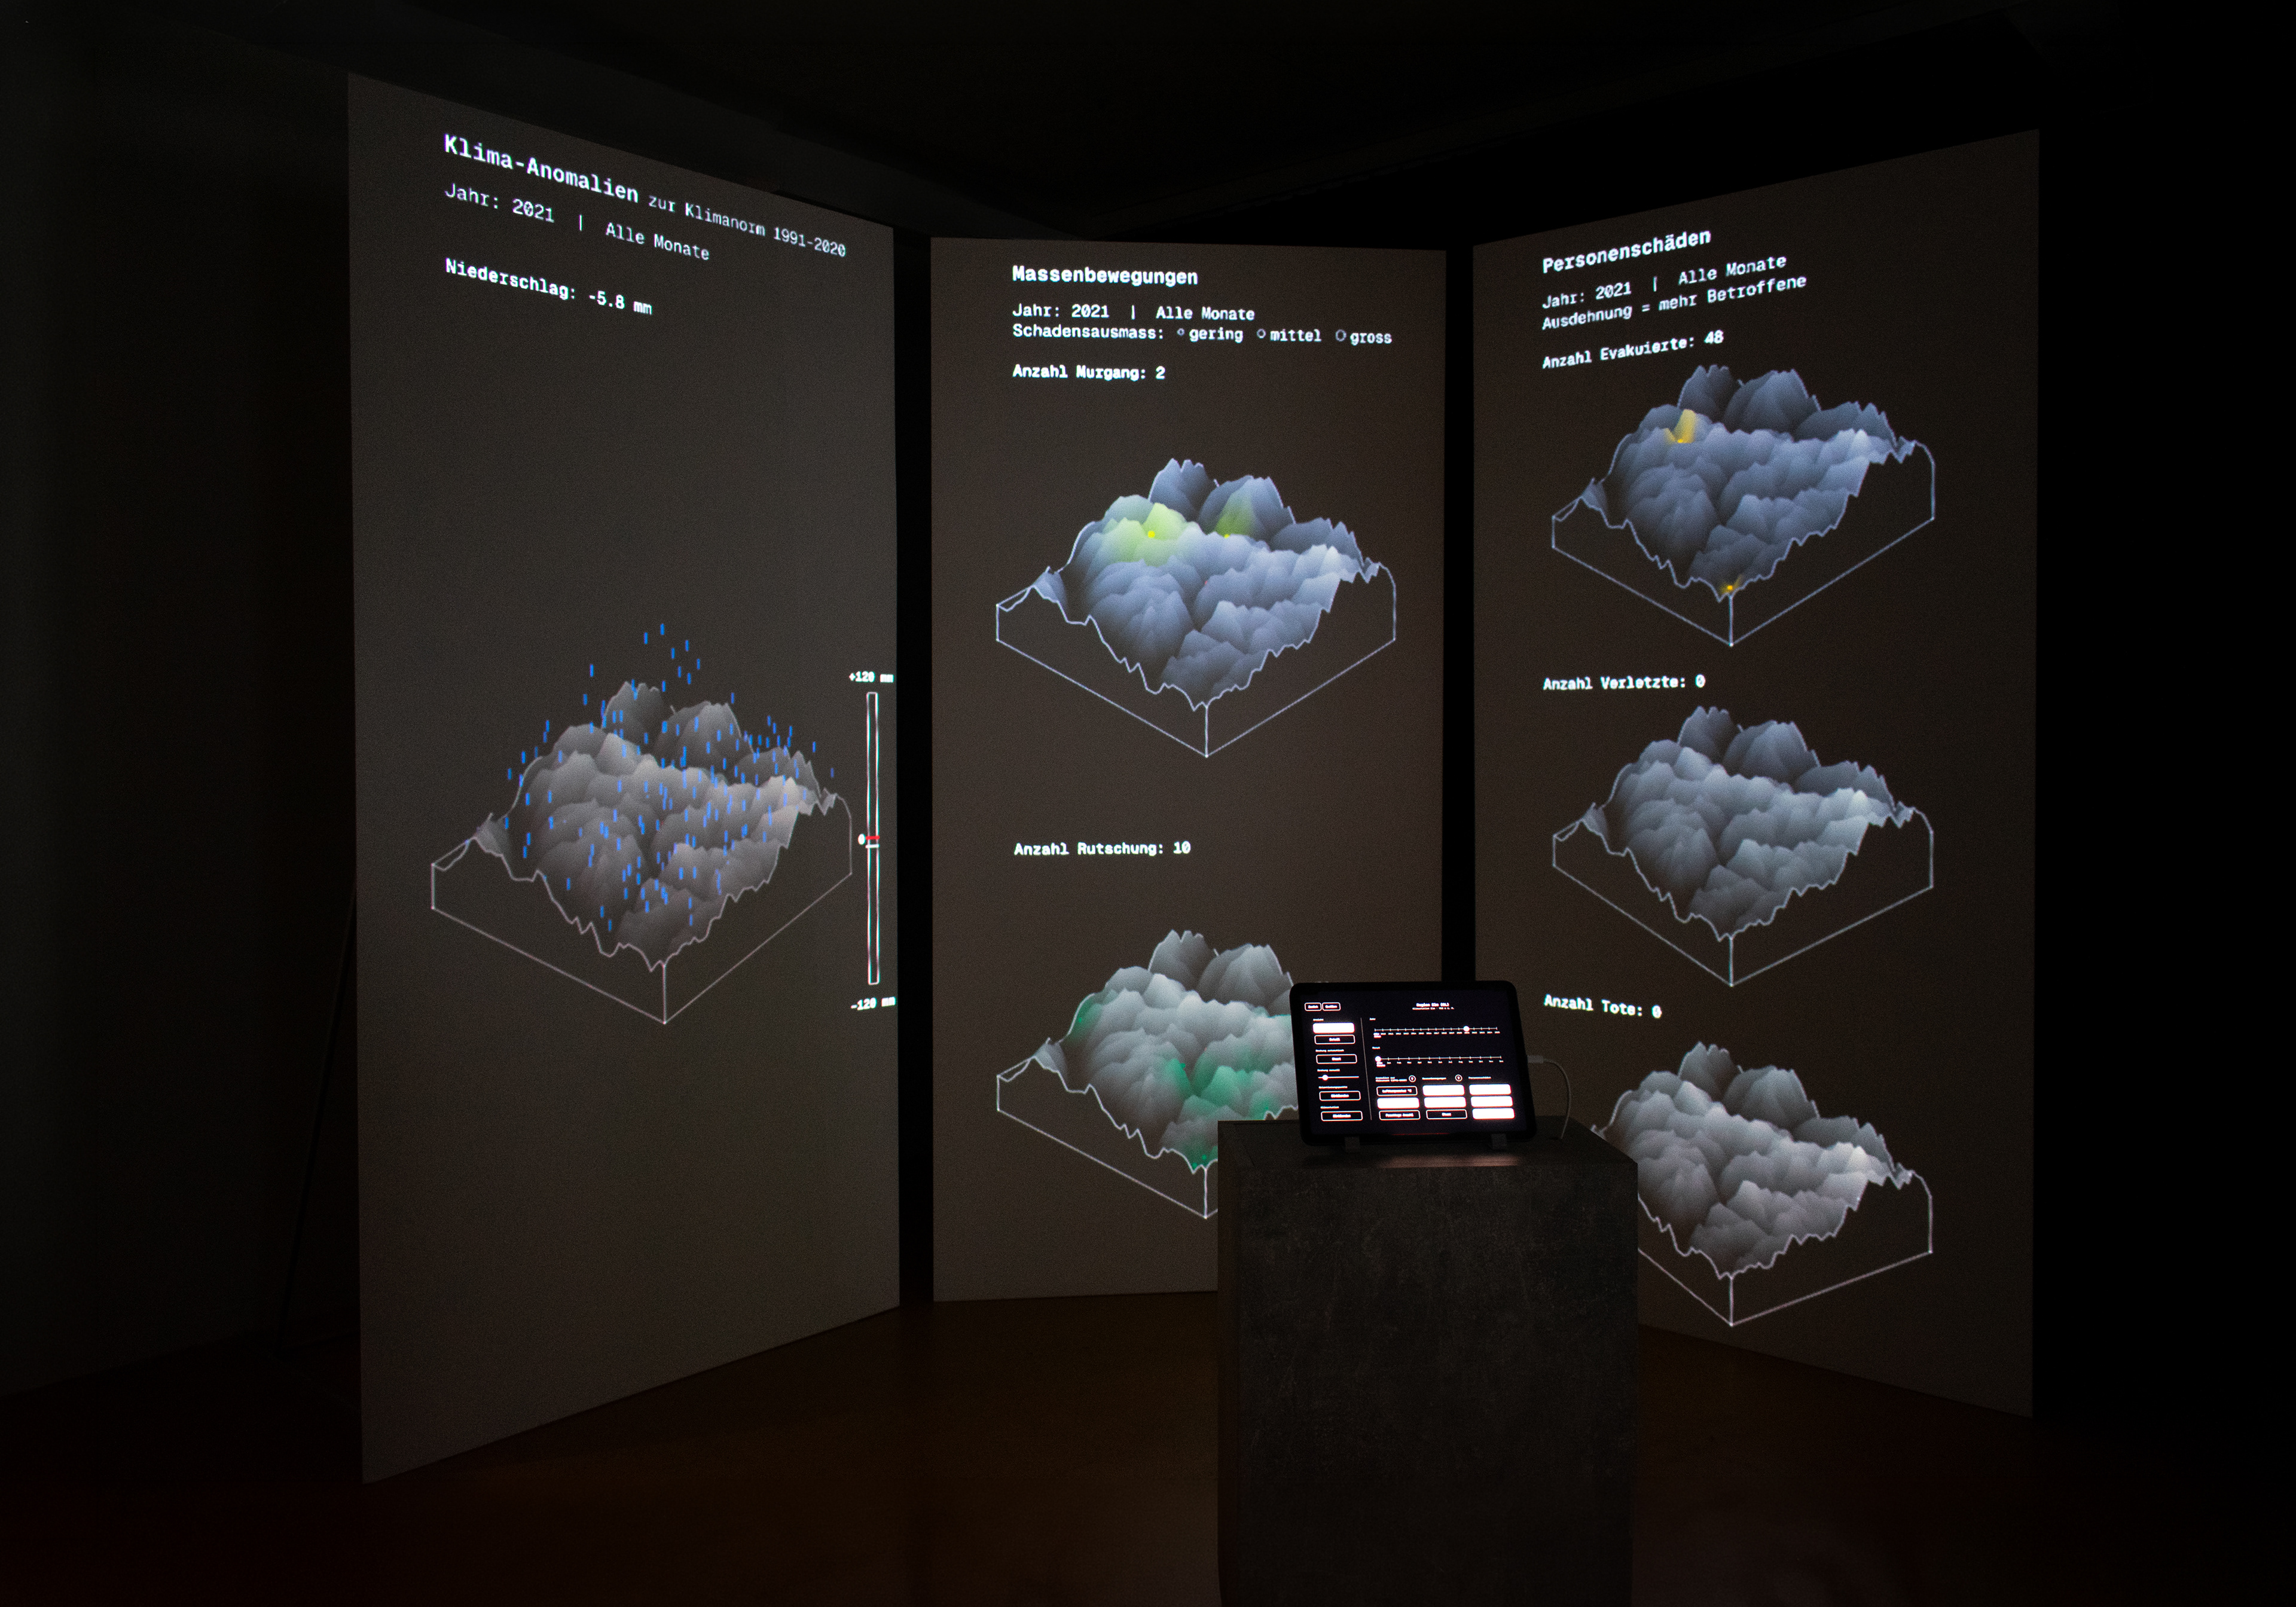
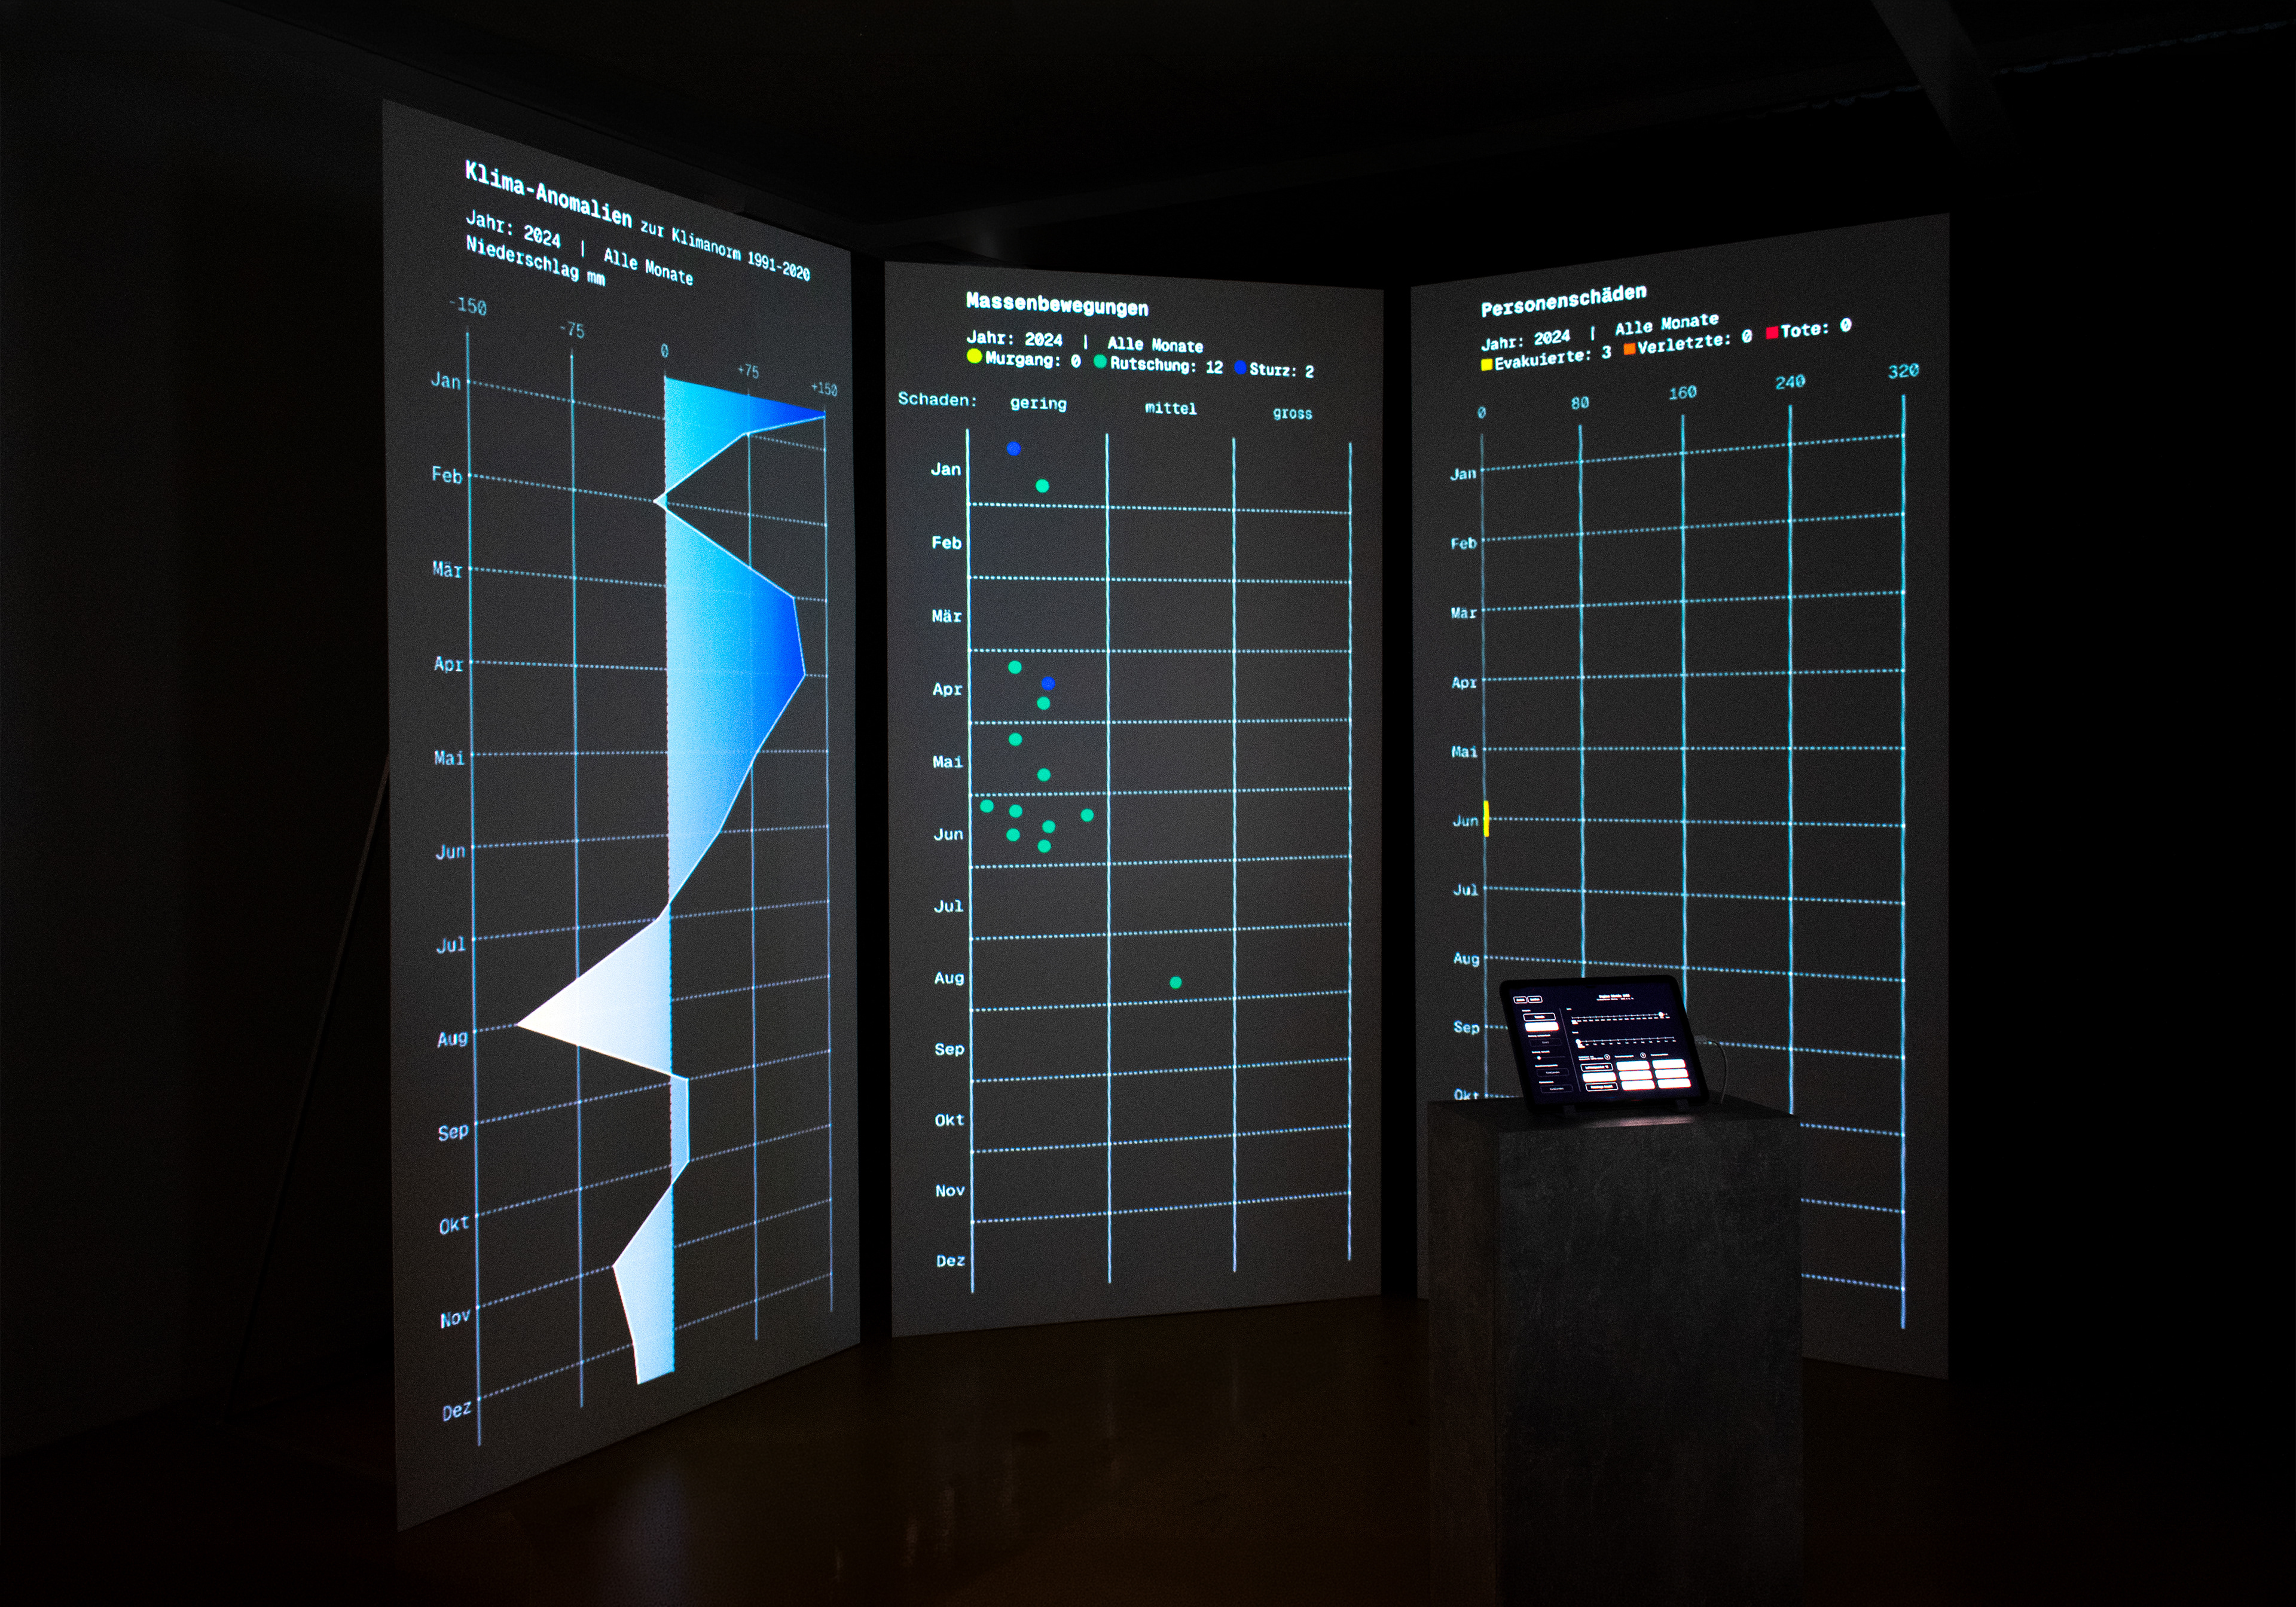
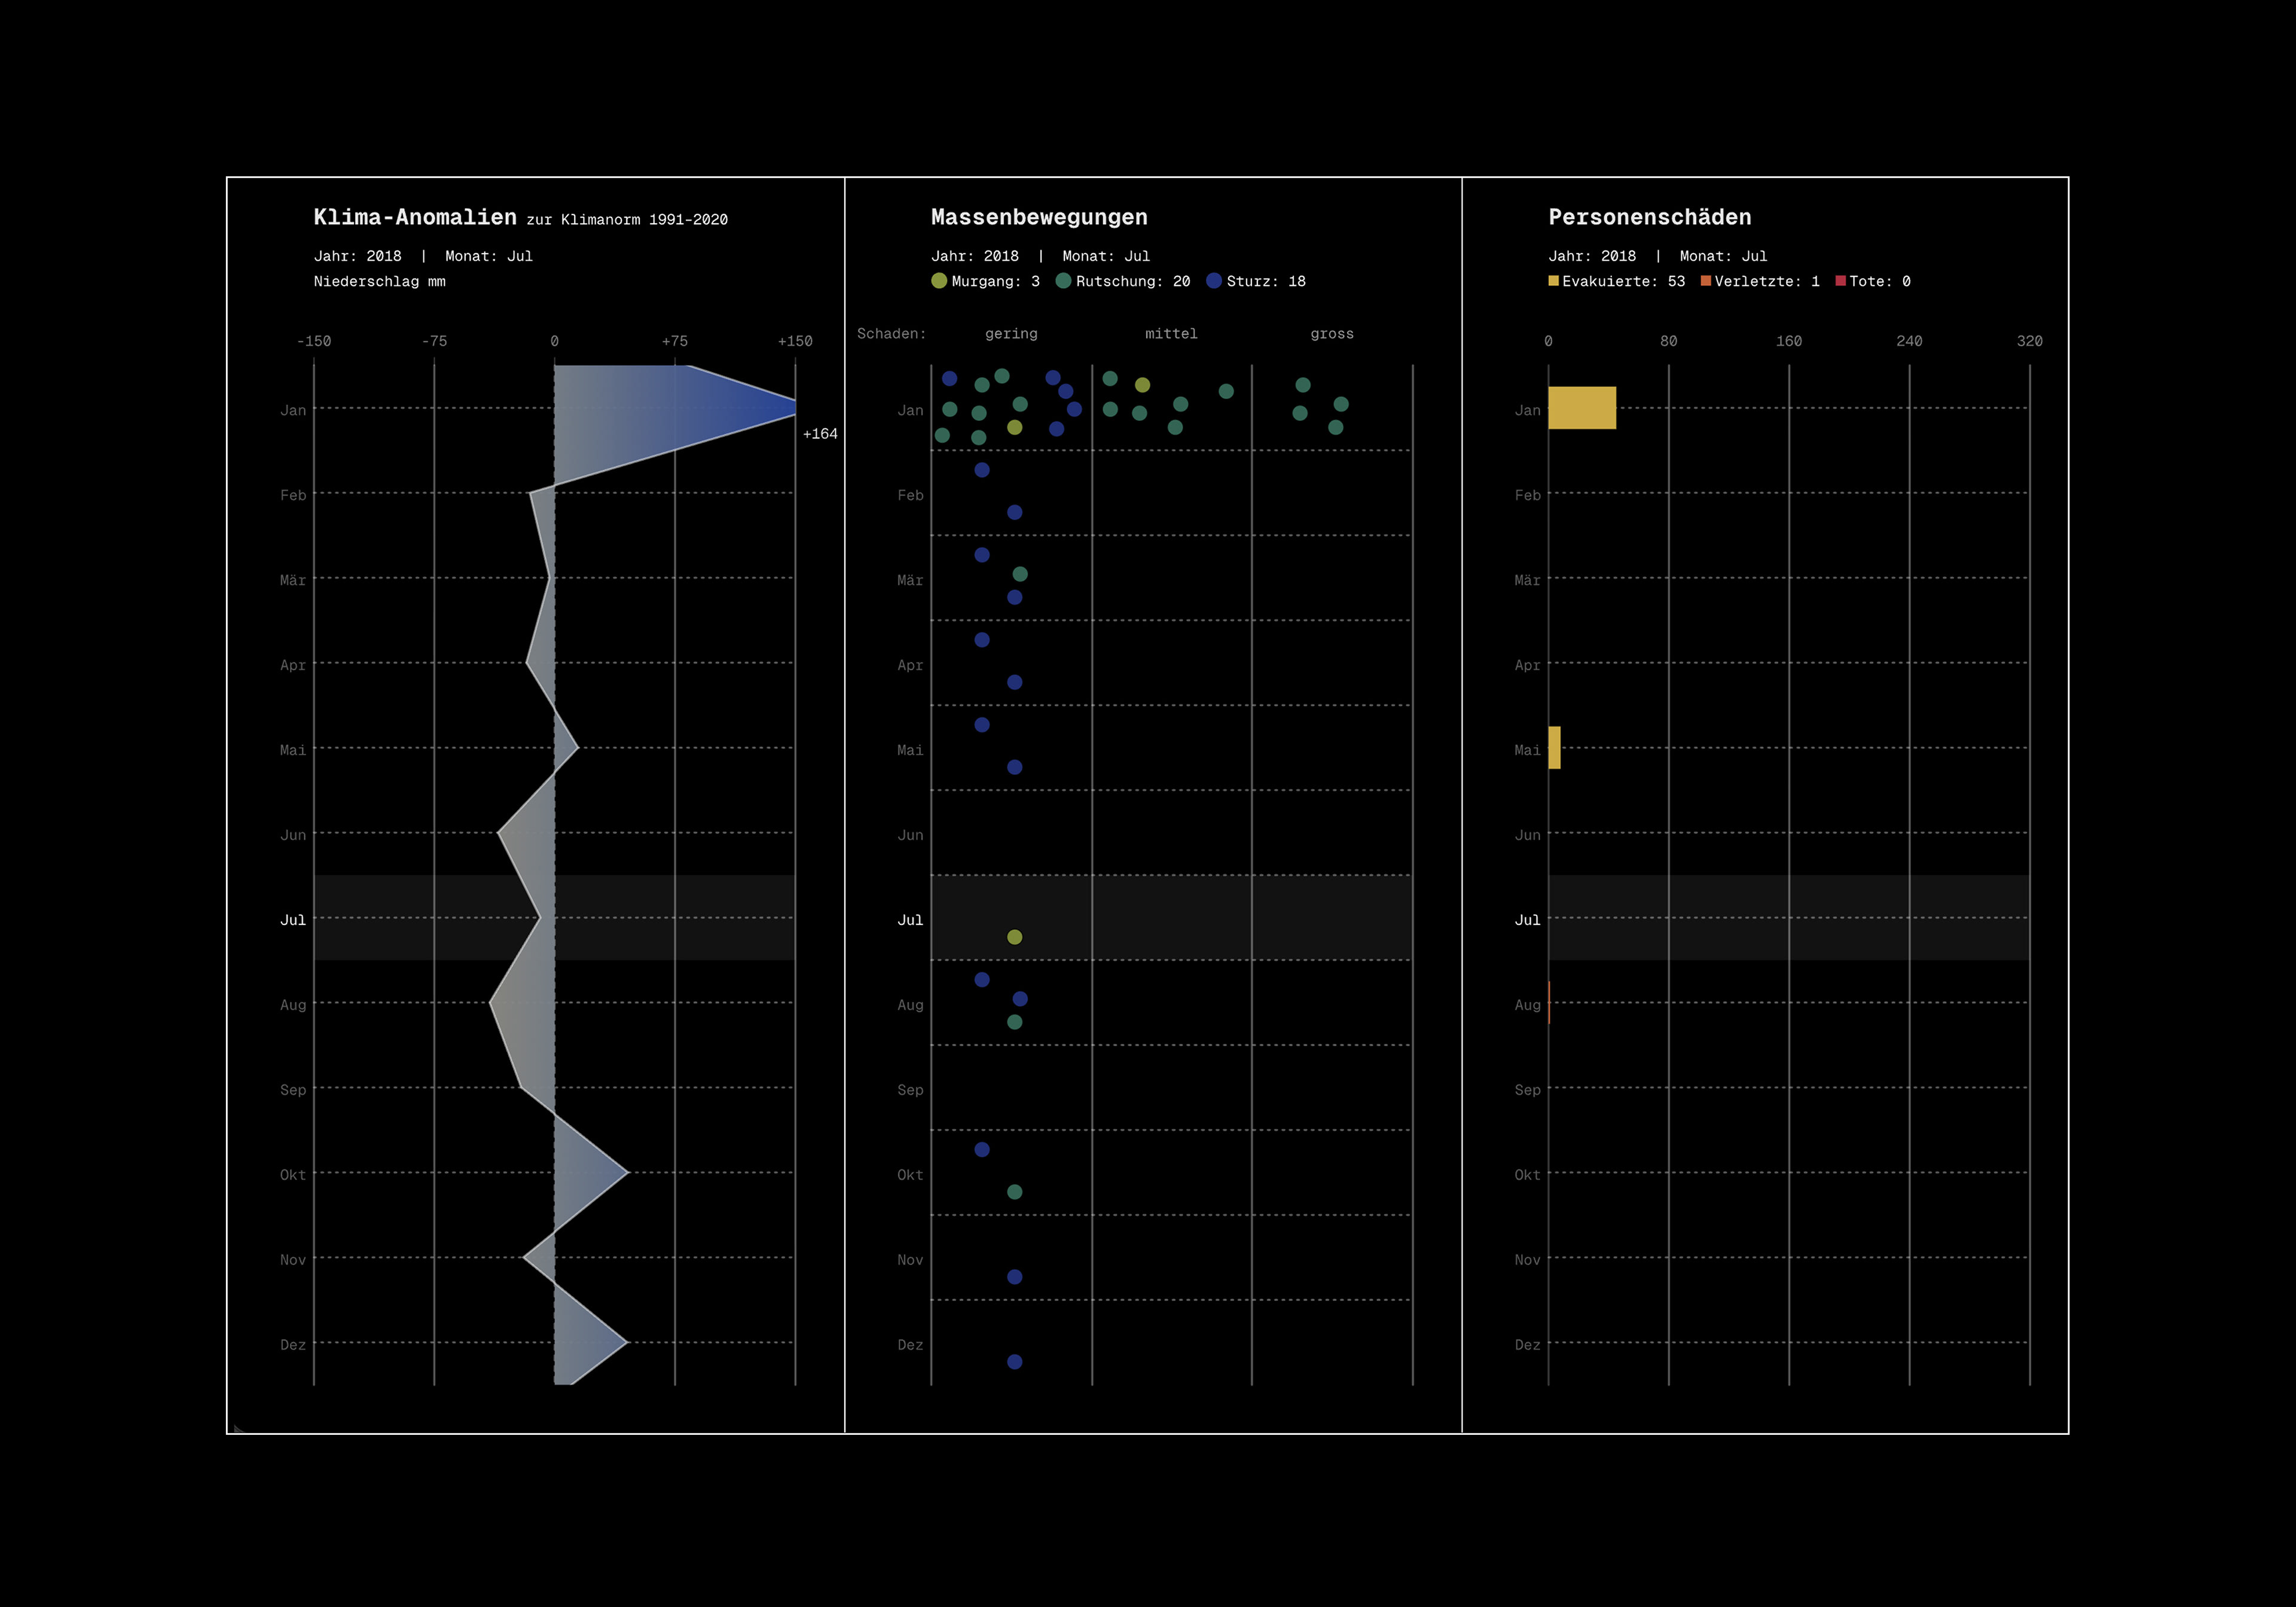
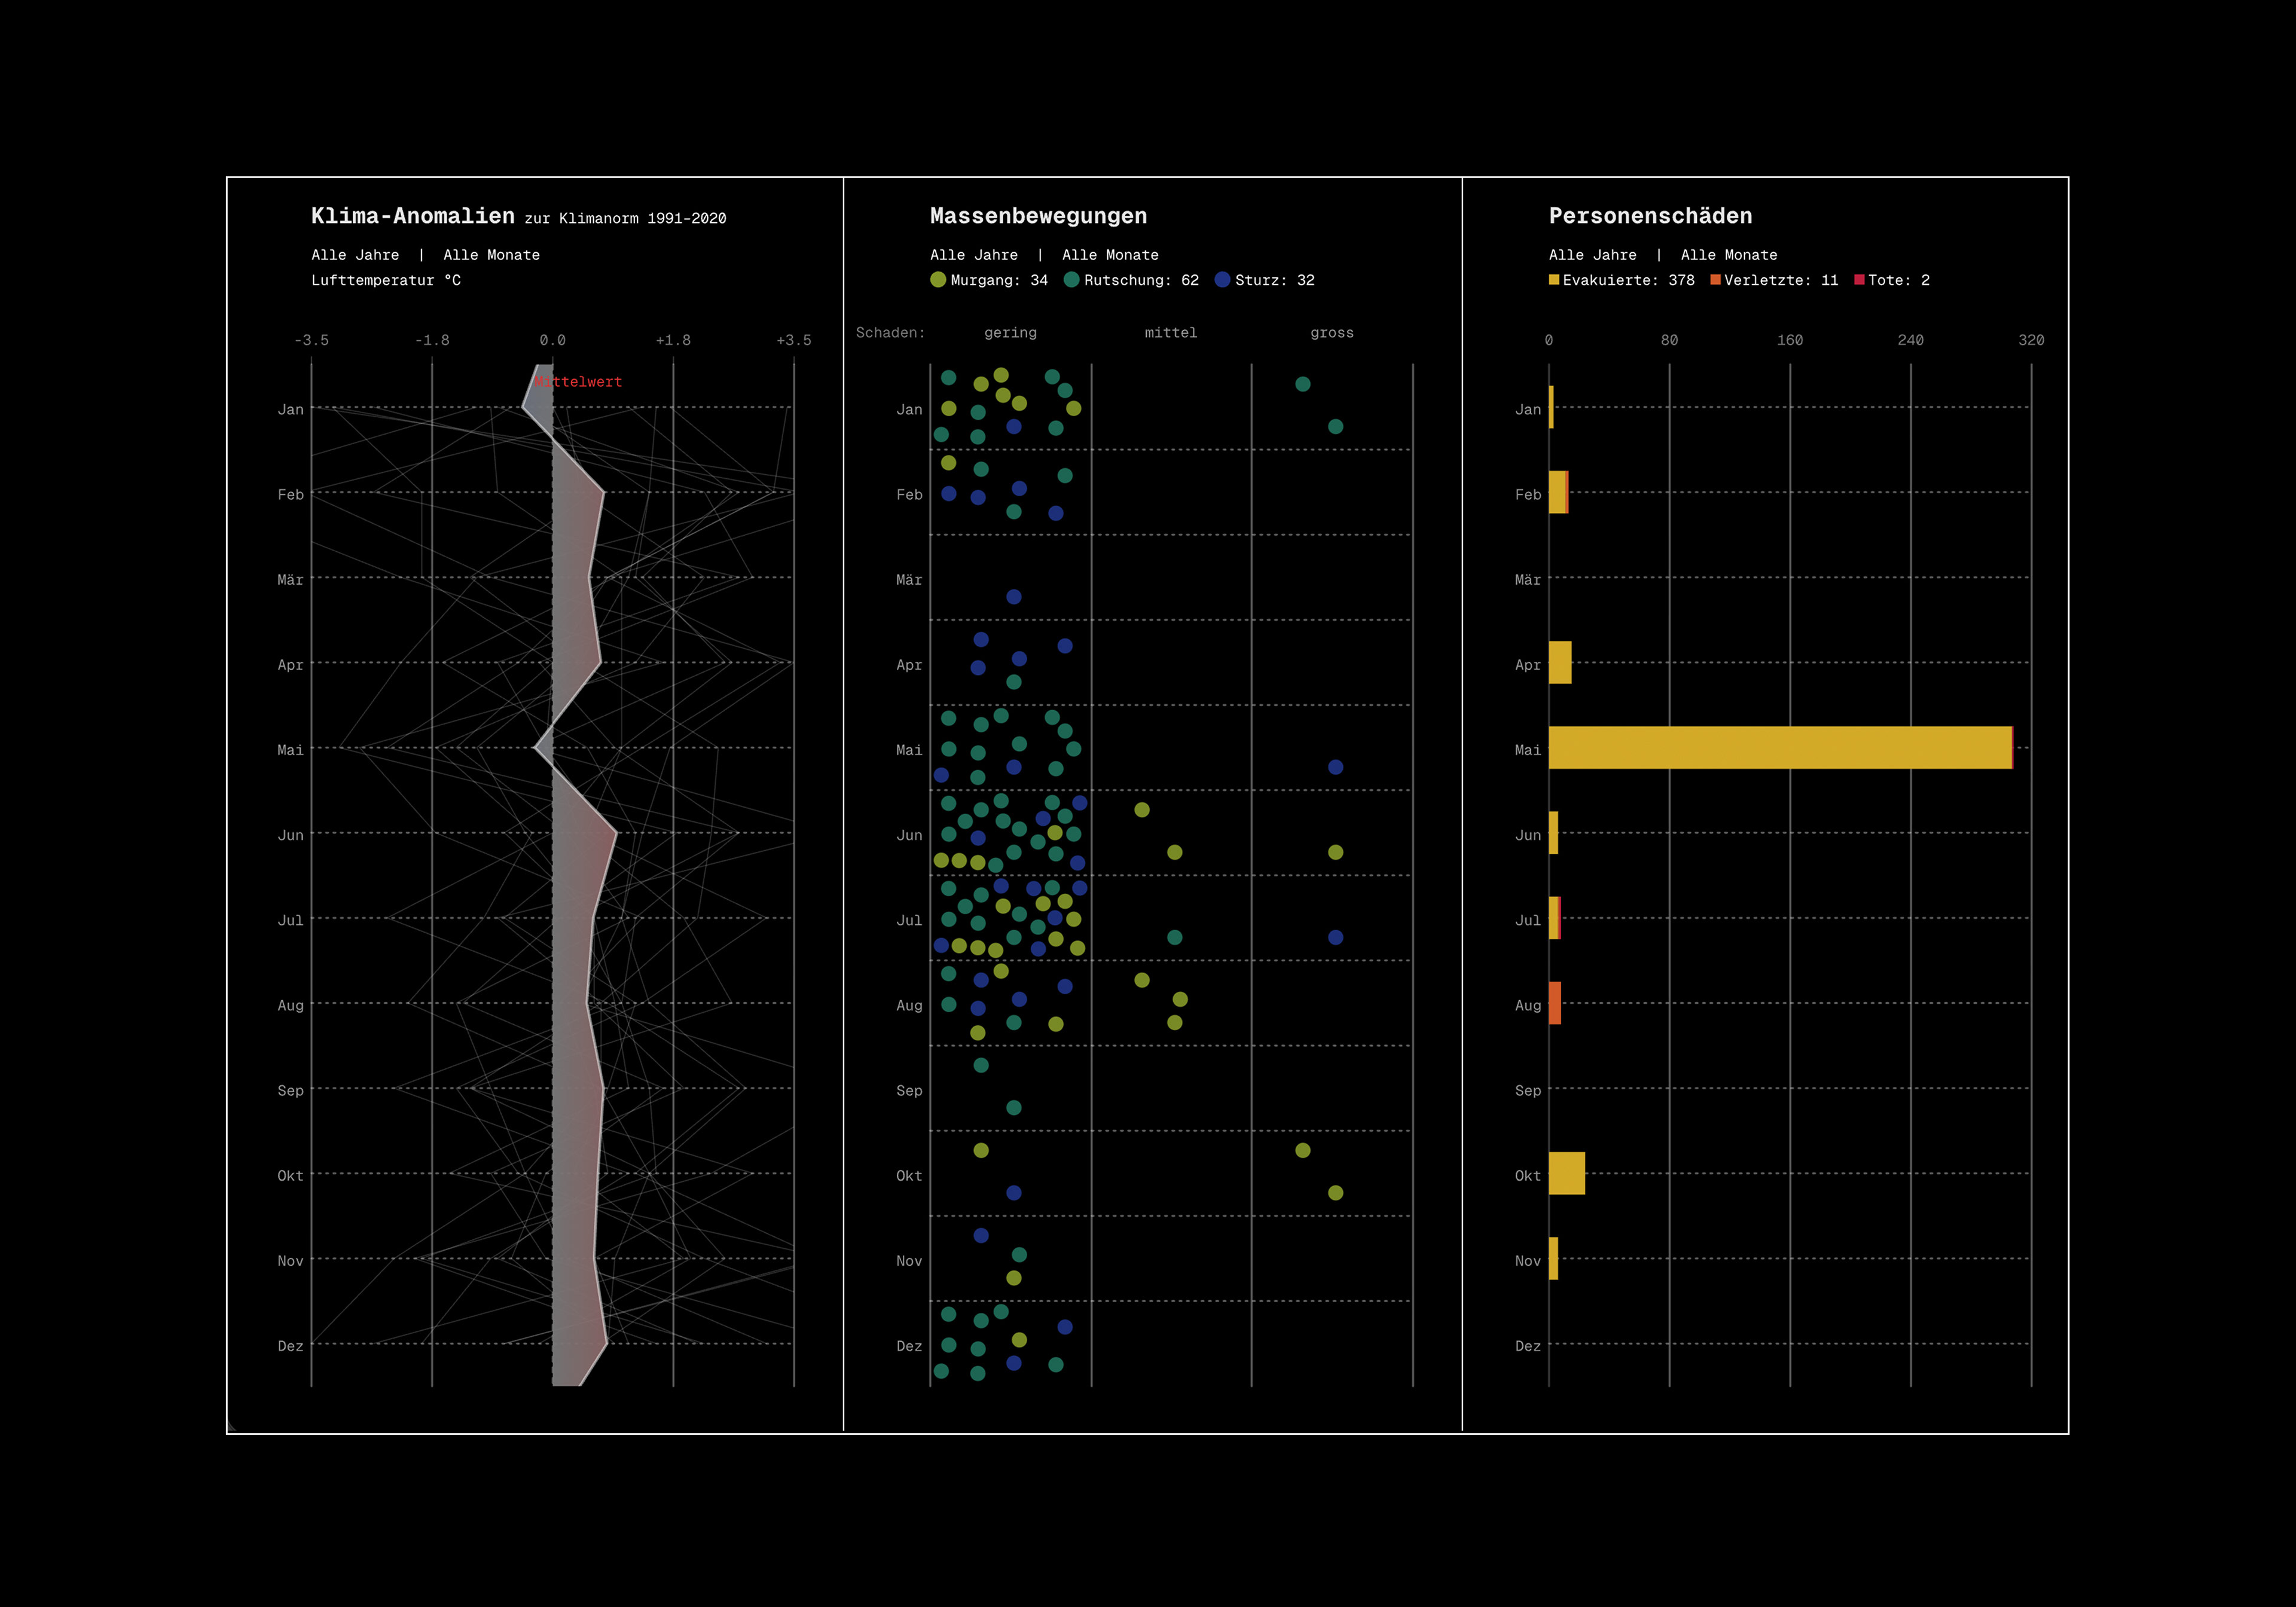
Geo referenced terrains that show the location of the climate station and its defined area around it. The left panel works as the climate panel (Driver), in the middle we have the mass movements (Event) and on the right the casualties (Consequences).
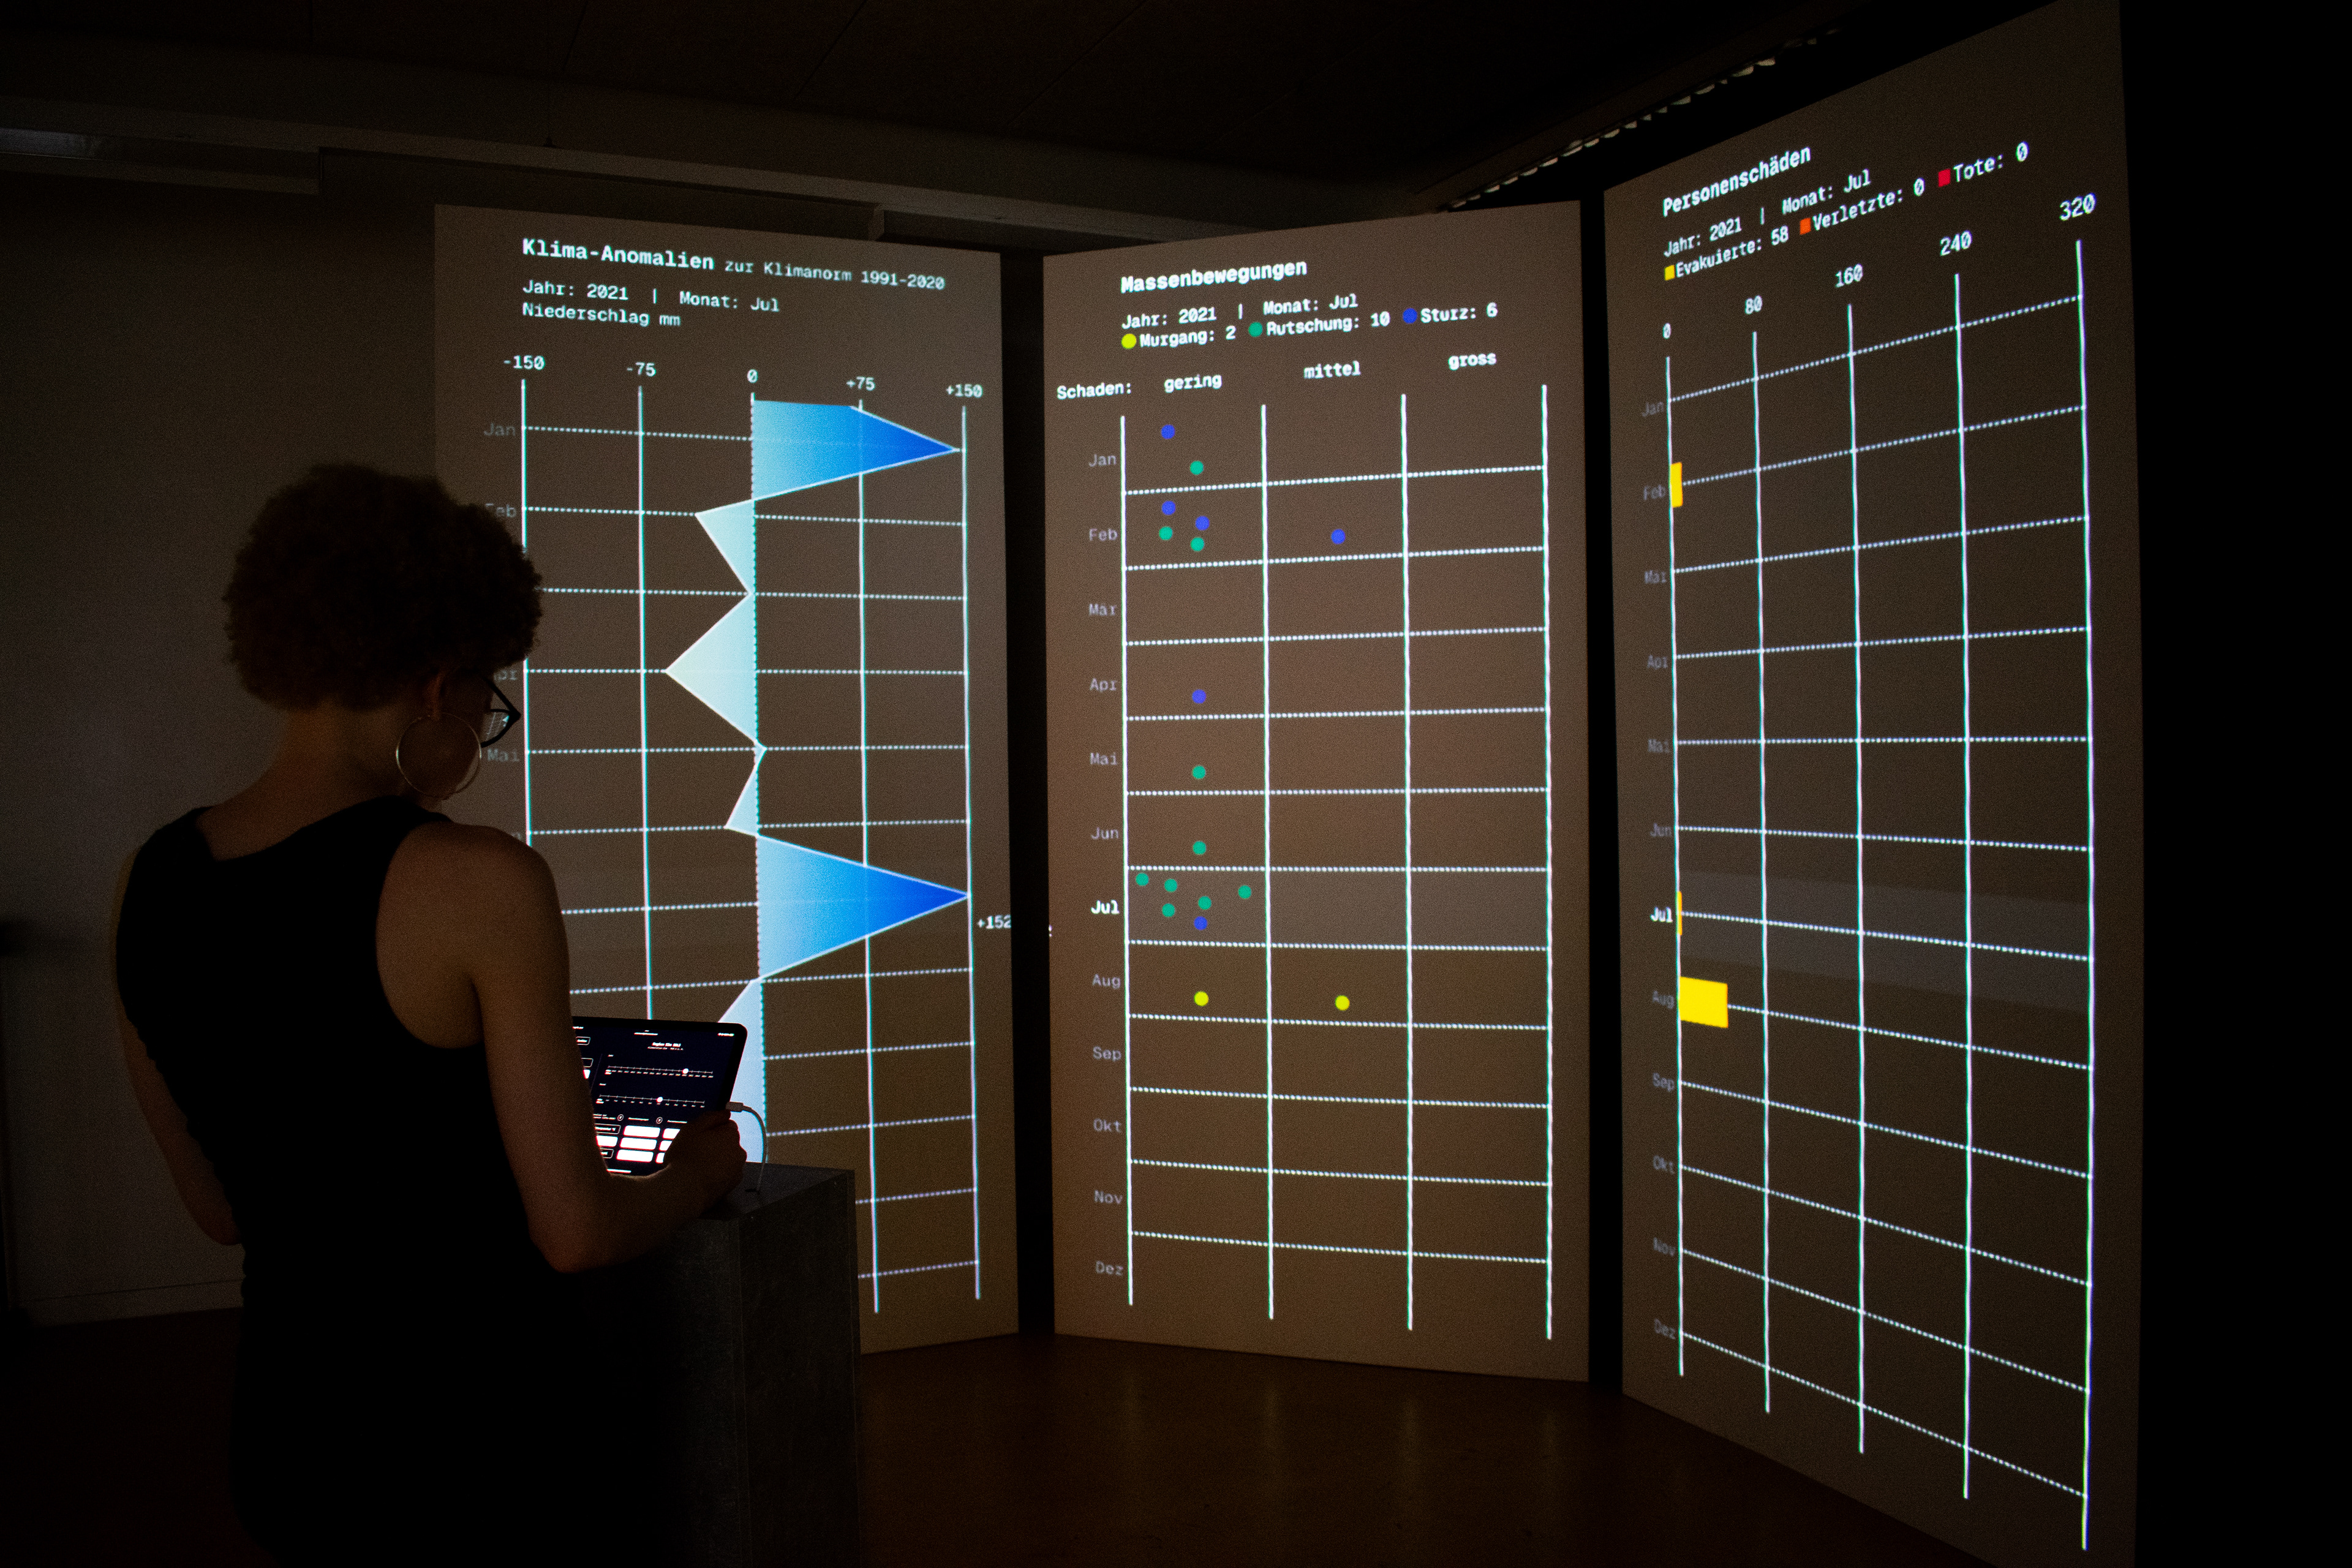
A visitor interacts with the detail view of the installation.
Selected: precipitation anomaly to climate norm 1991–2020, debris flows and landslides, such as evacuated, injured and dead people.
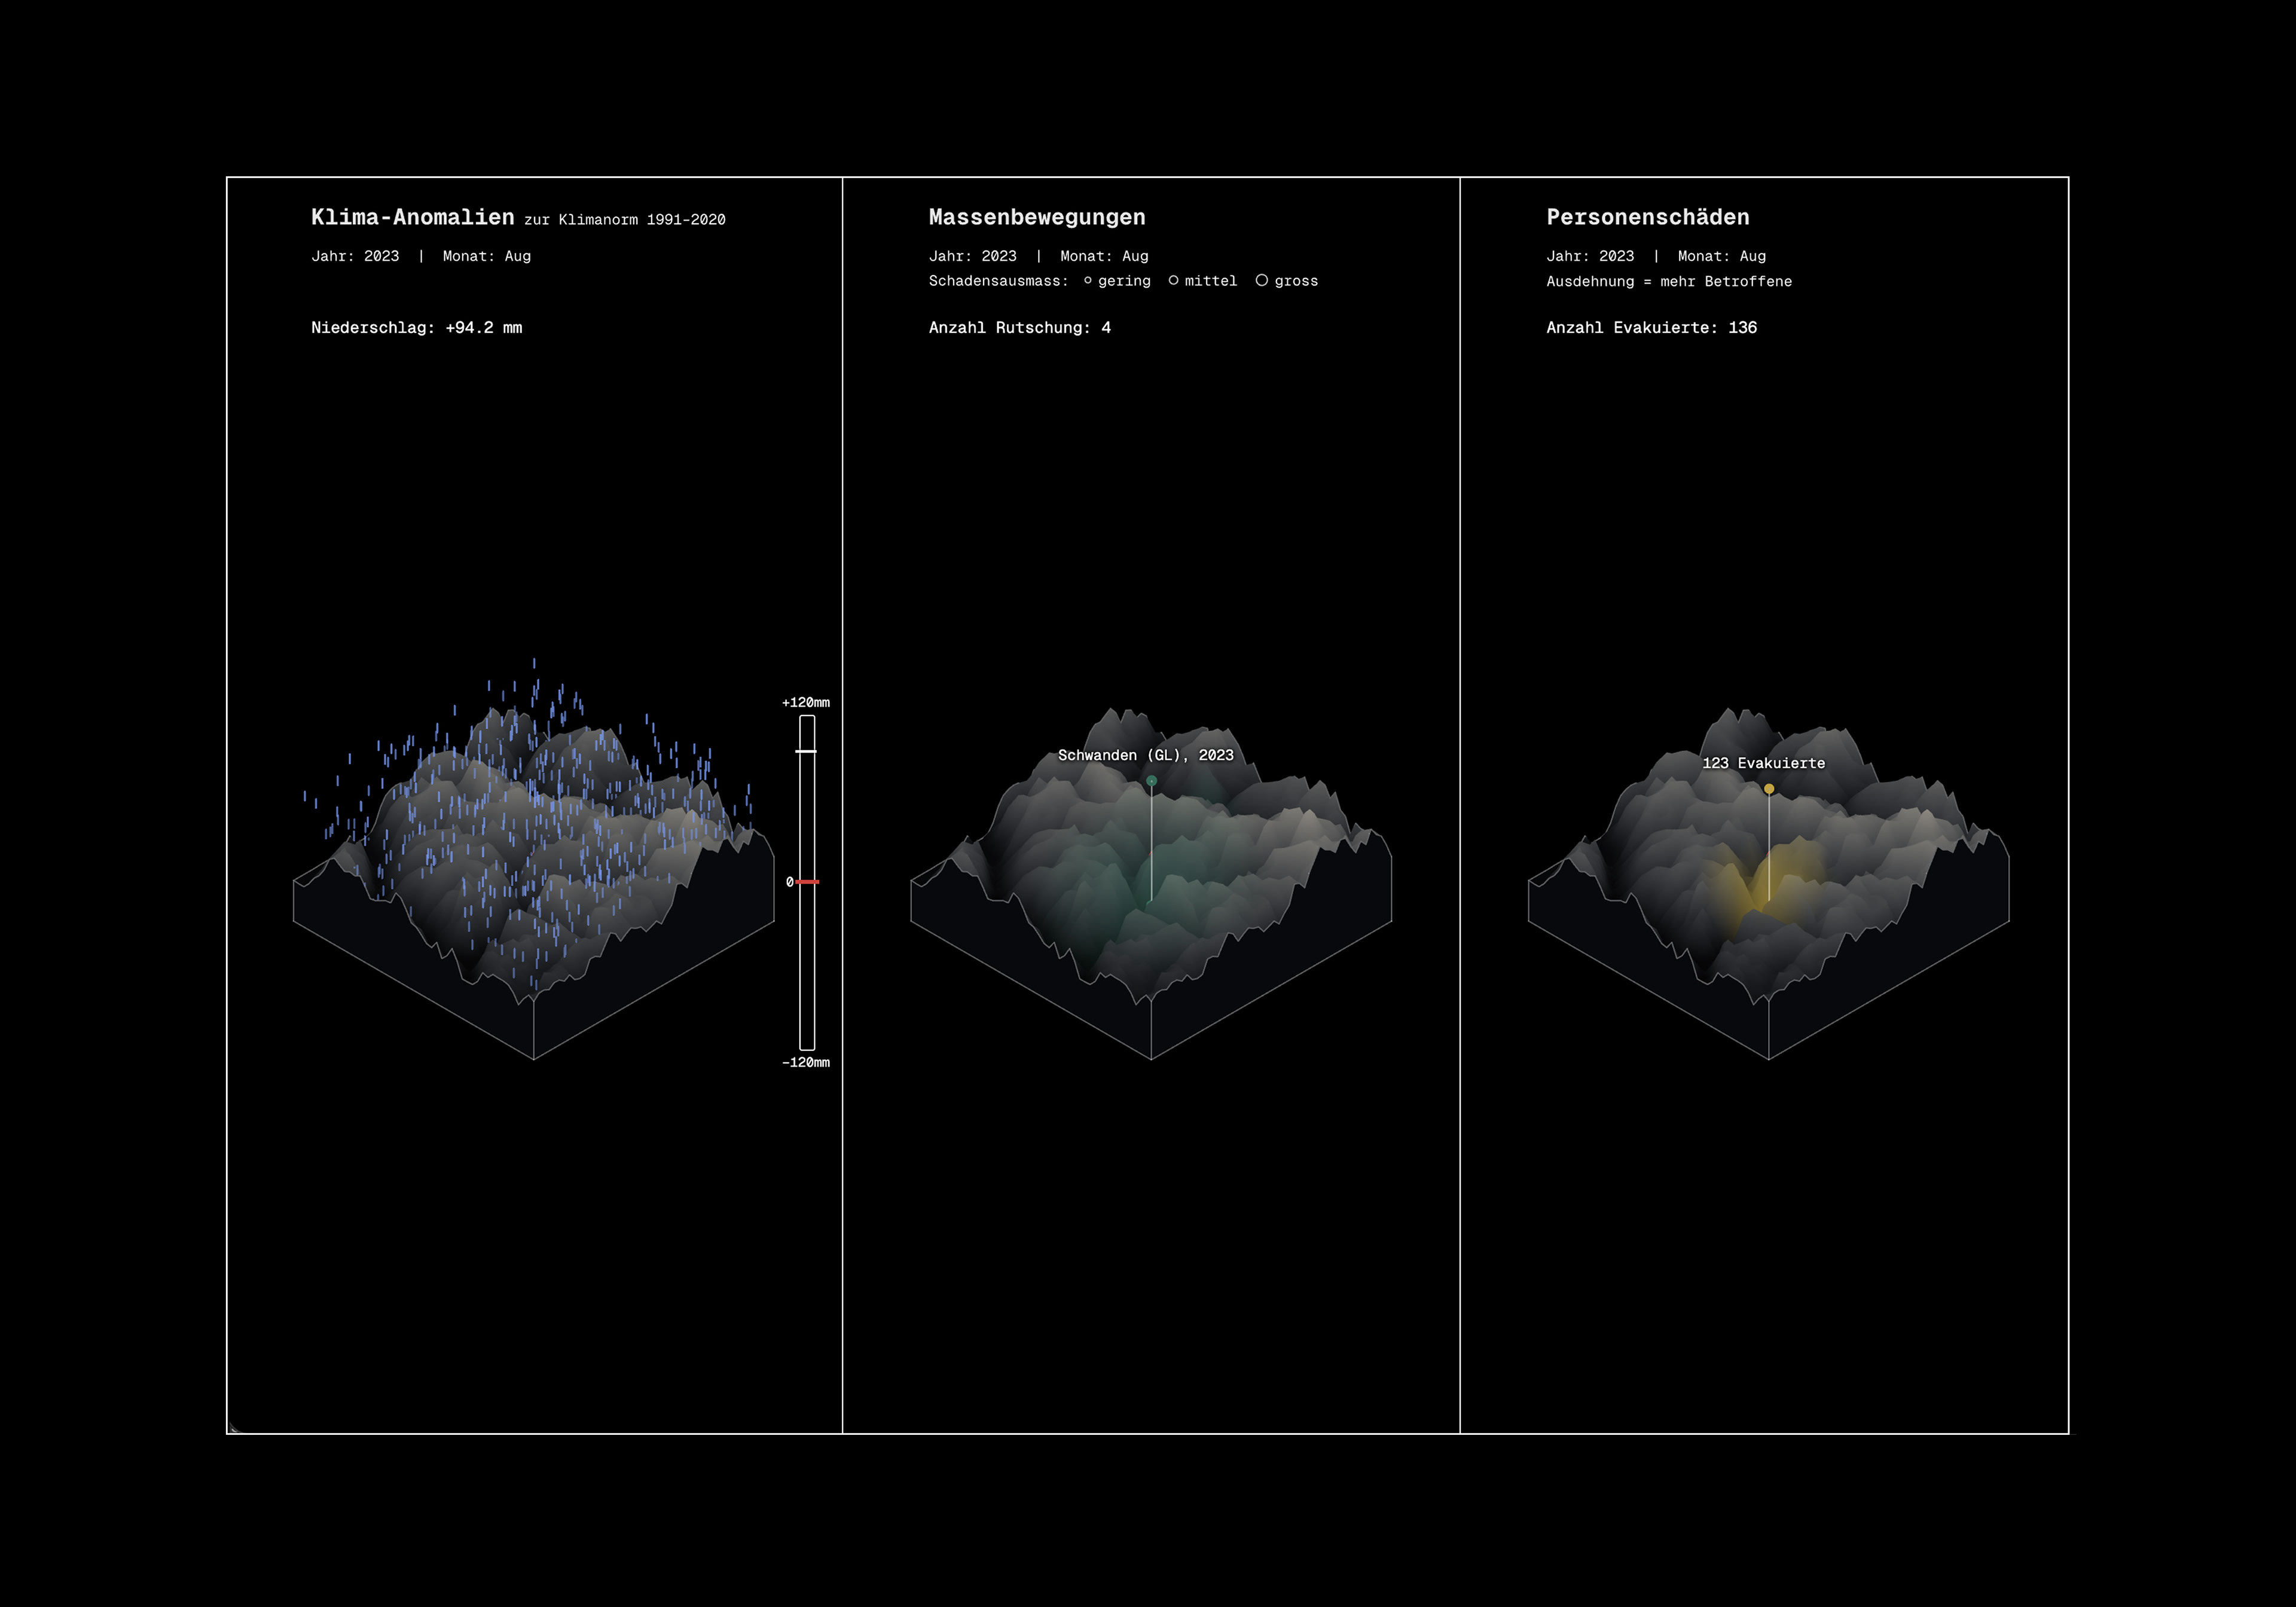
Detail view
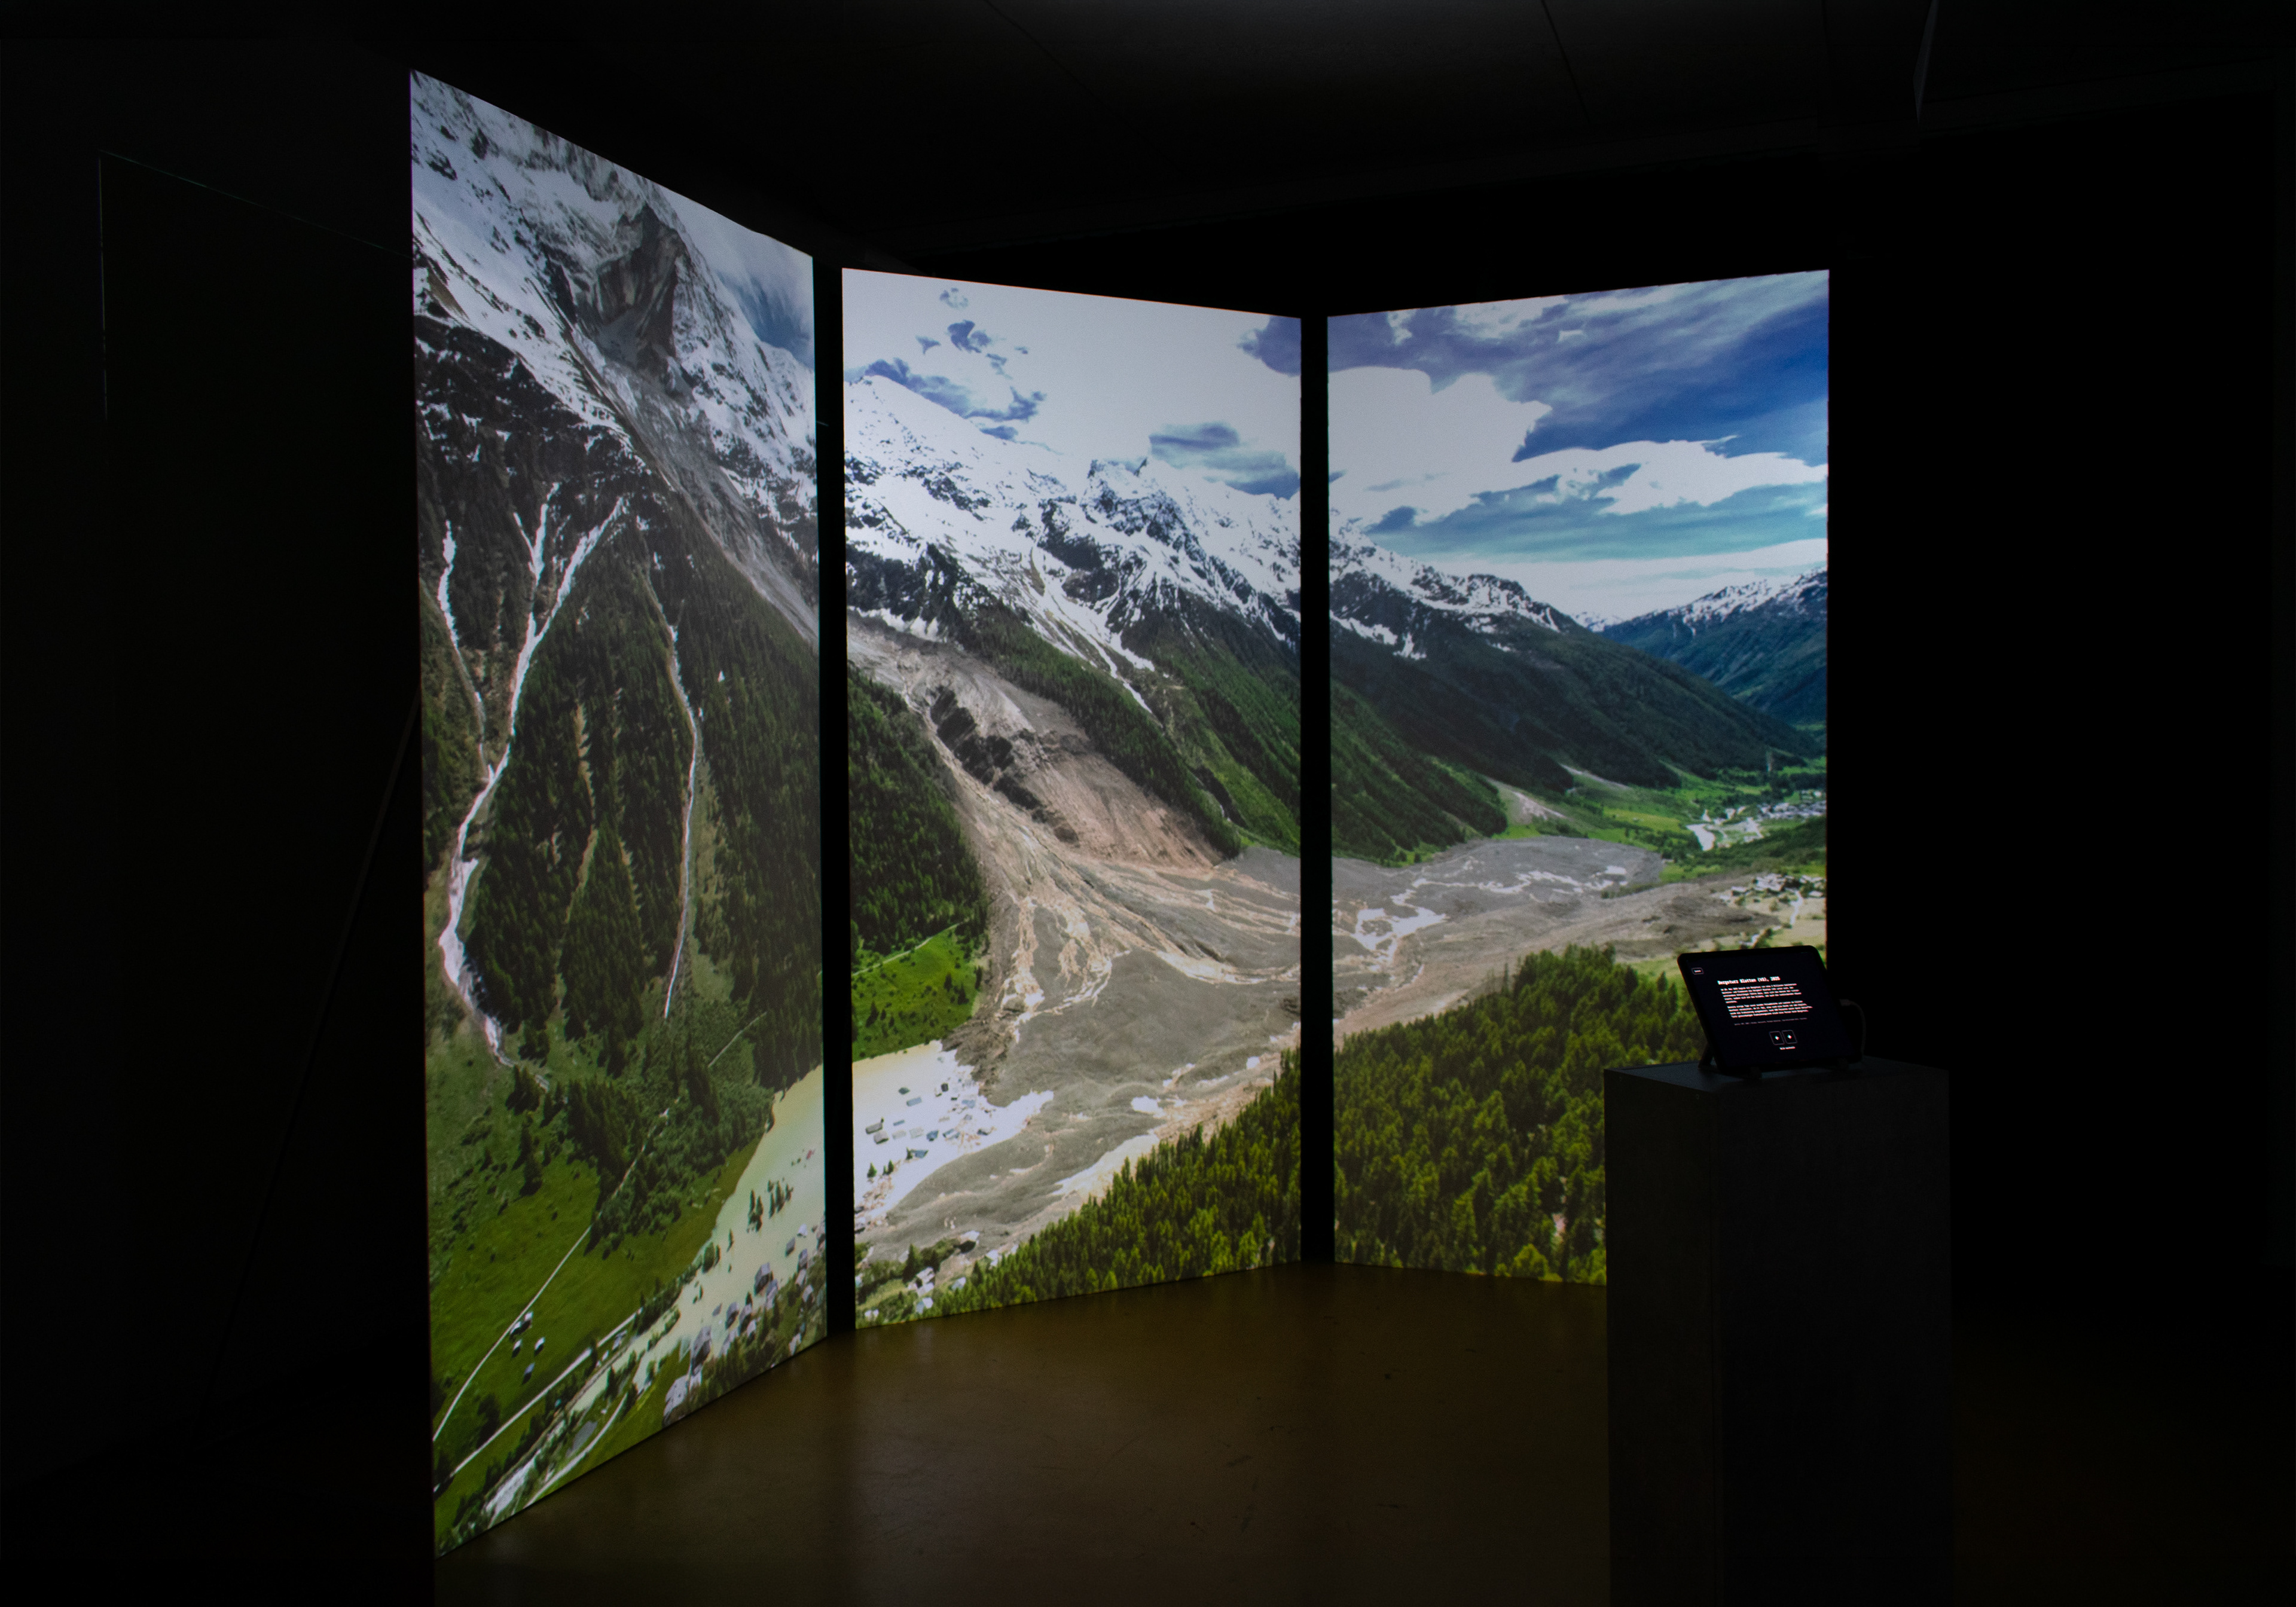
By selecting an extreme event such as Blatten, visitors can explore informations and pictures about it.
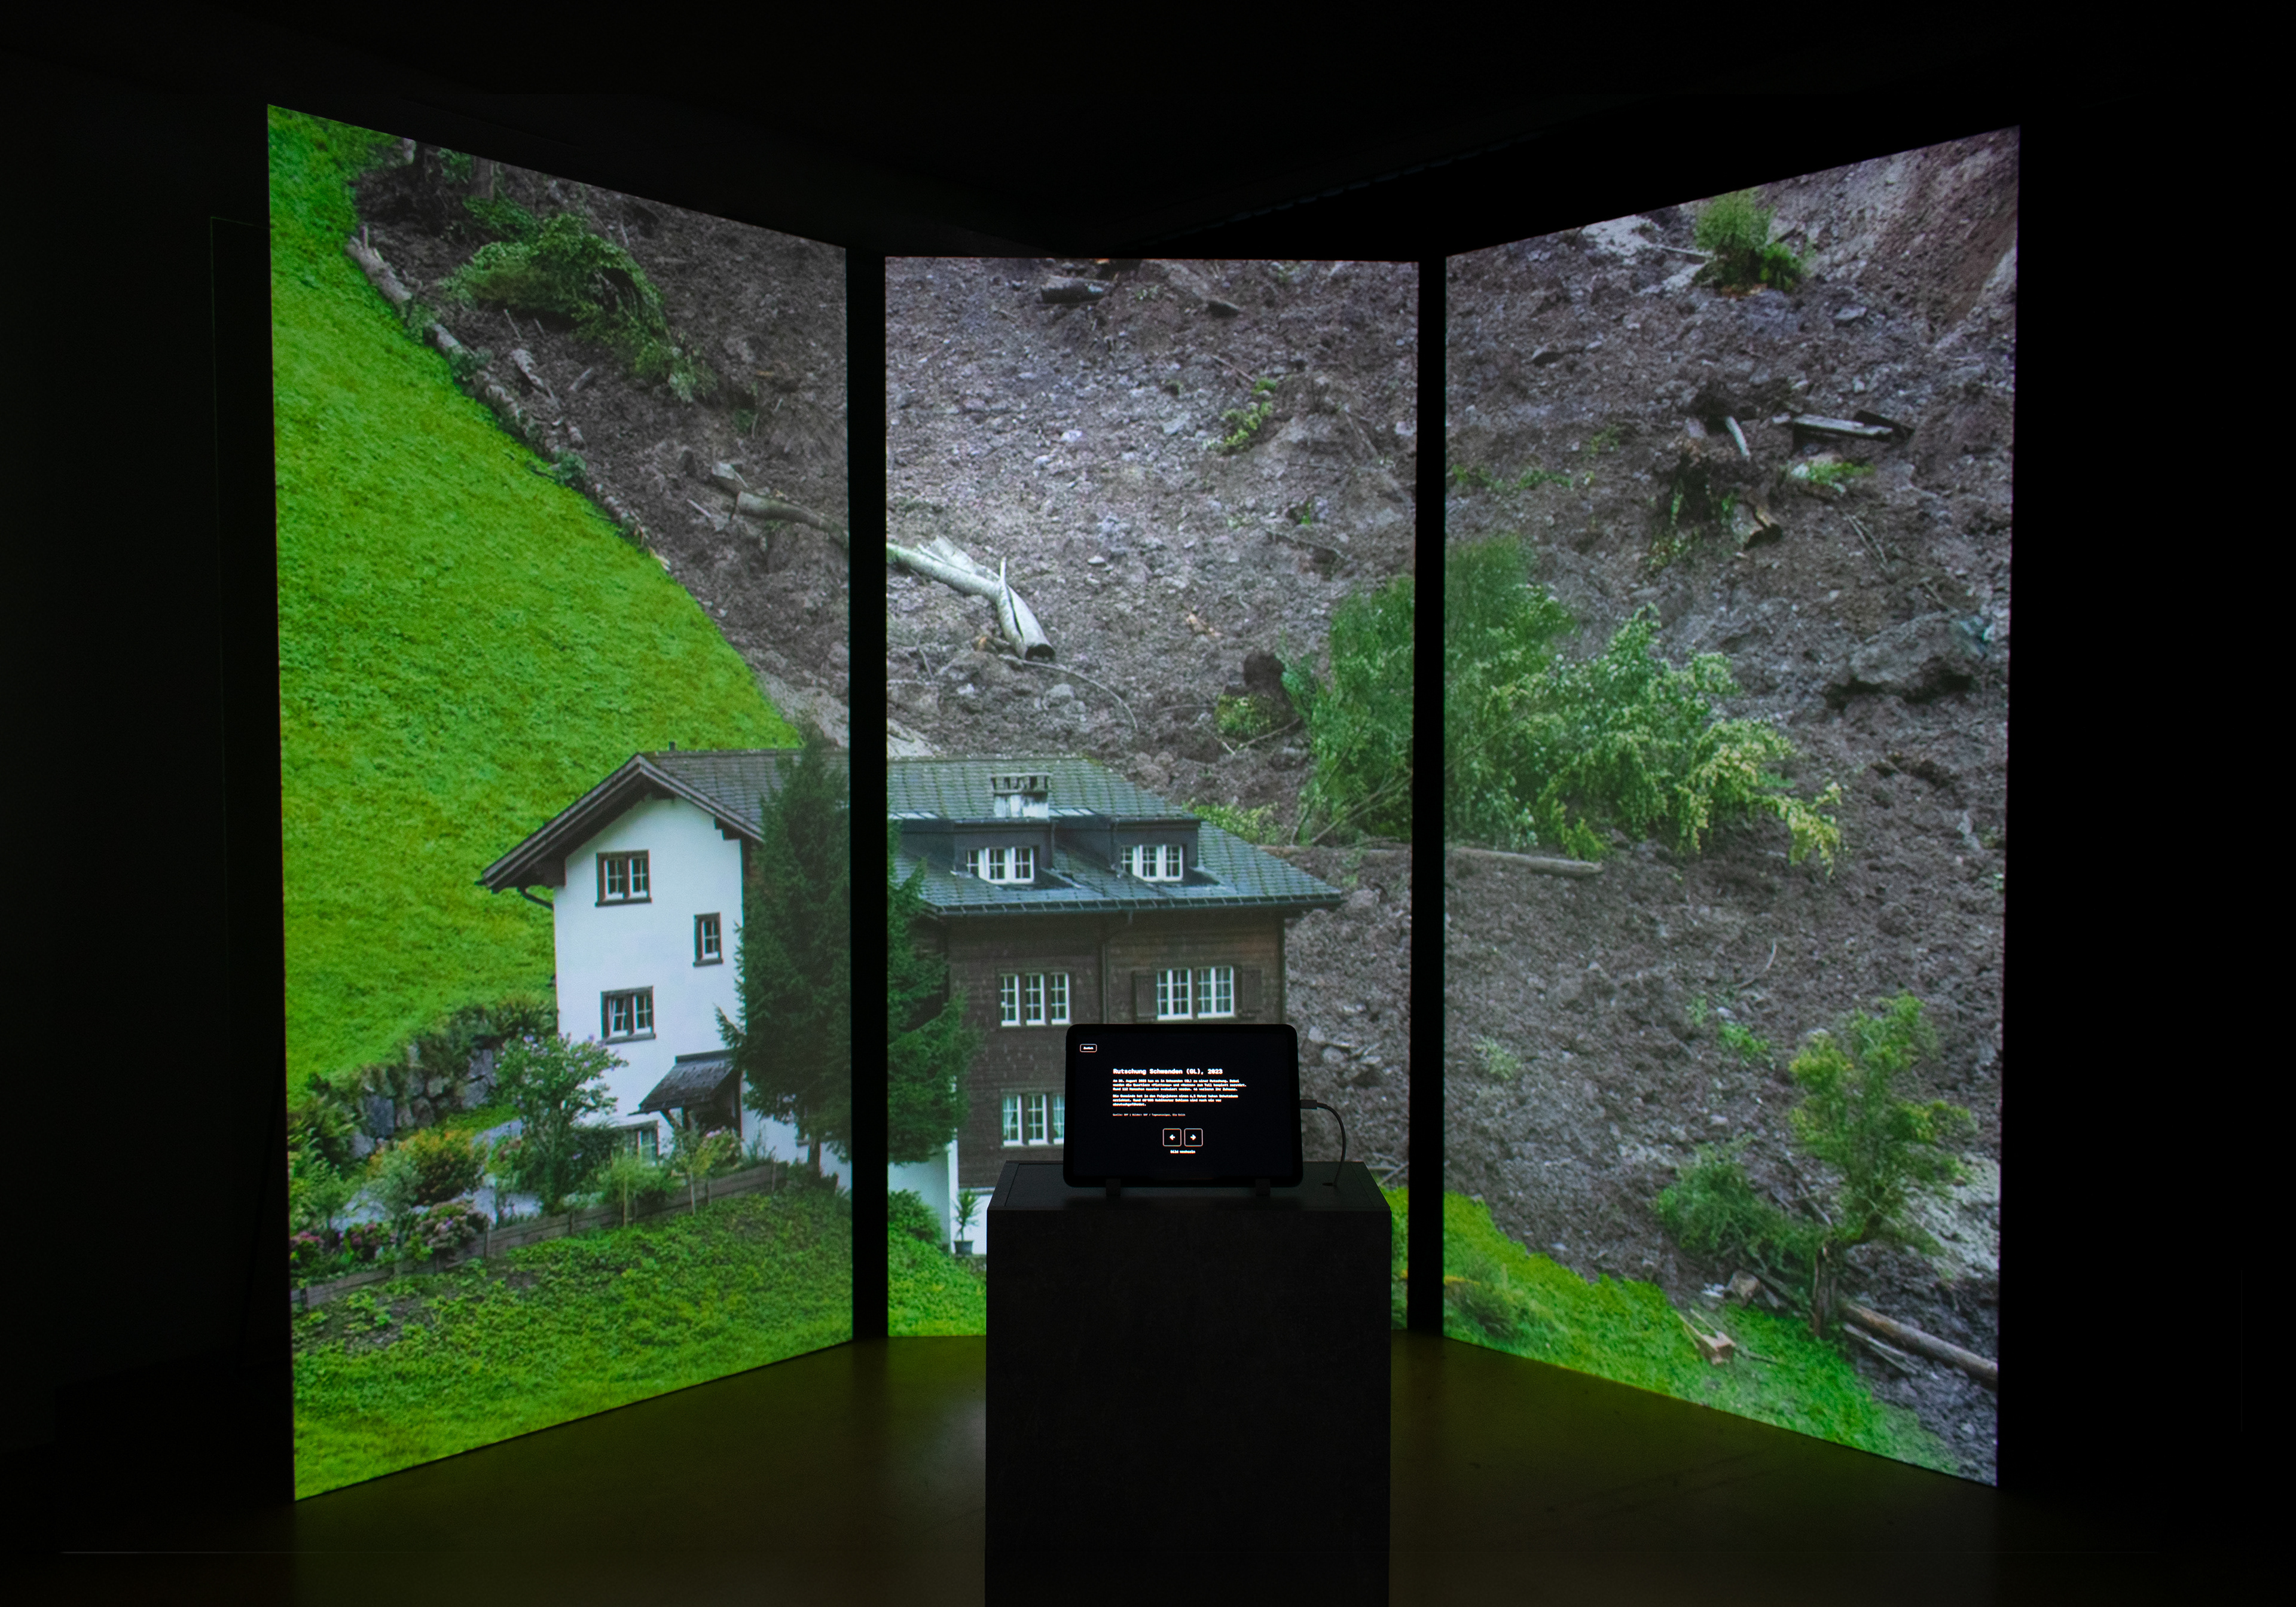
Extreme event Schwanden (GL)
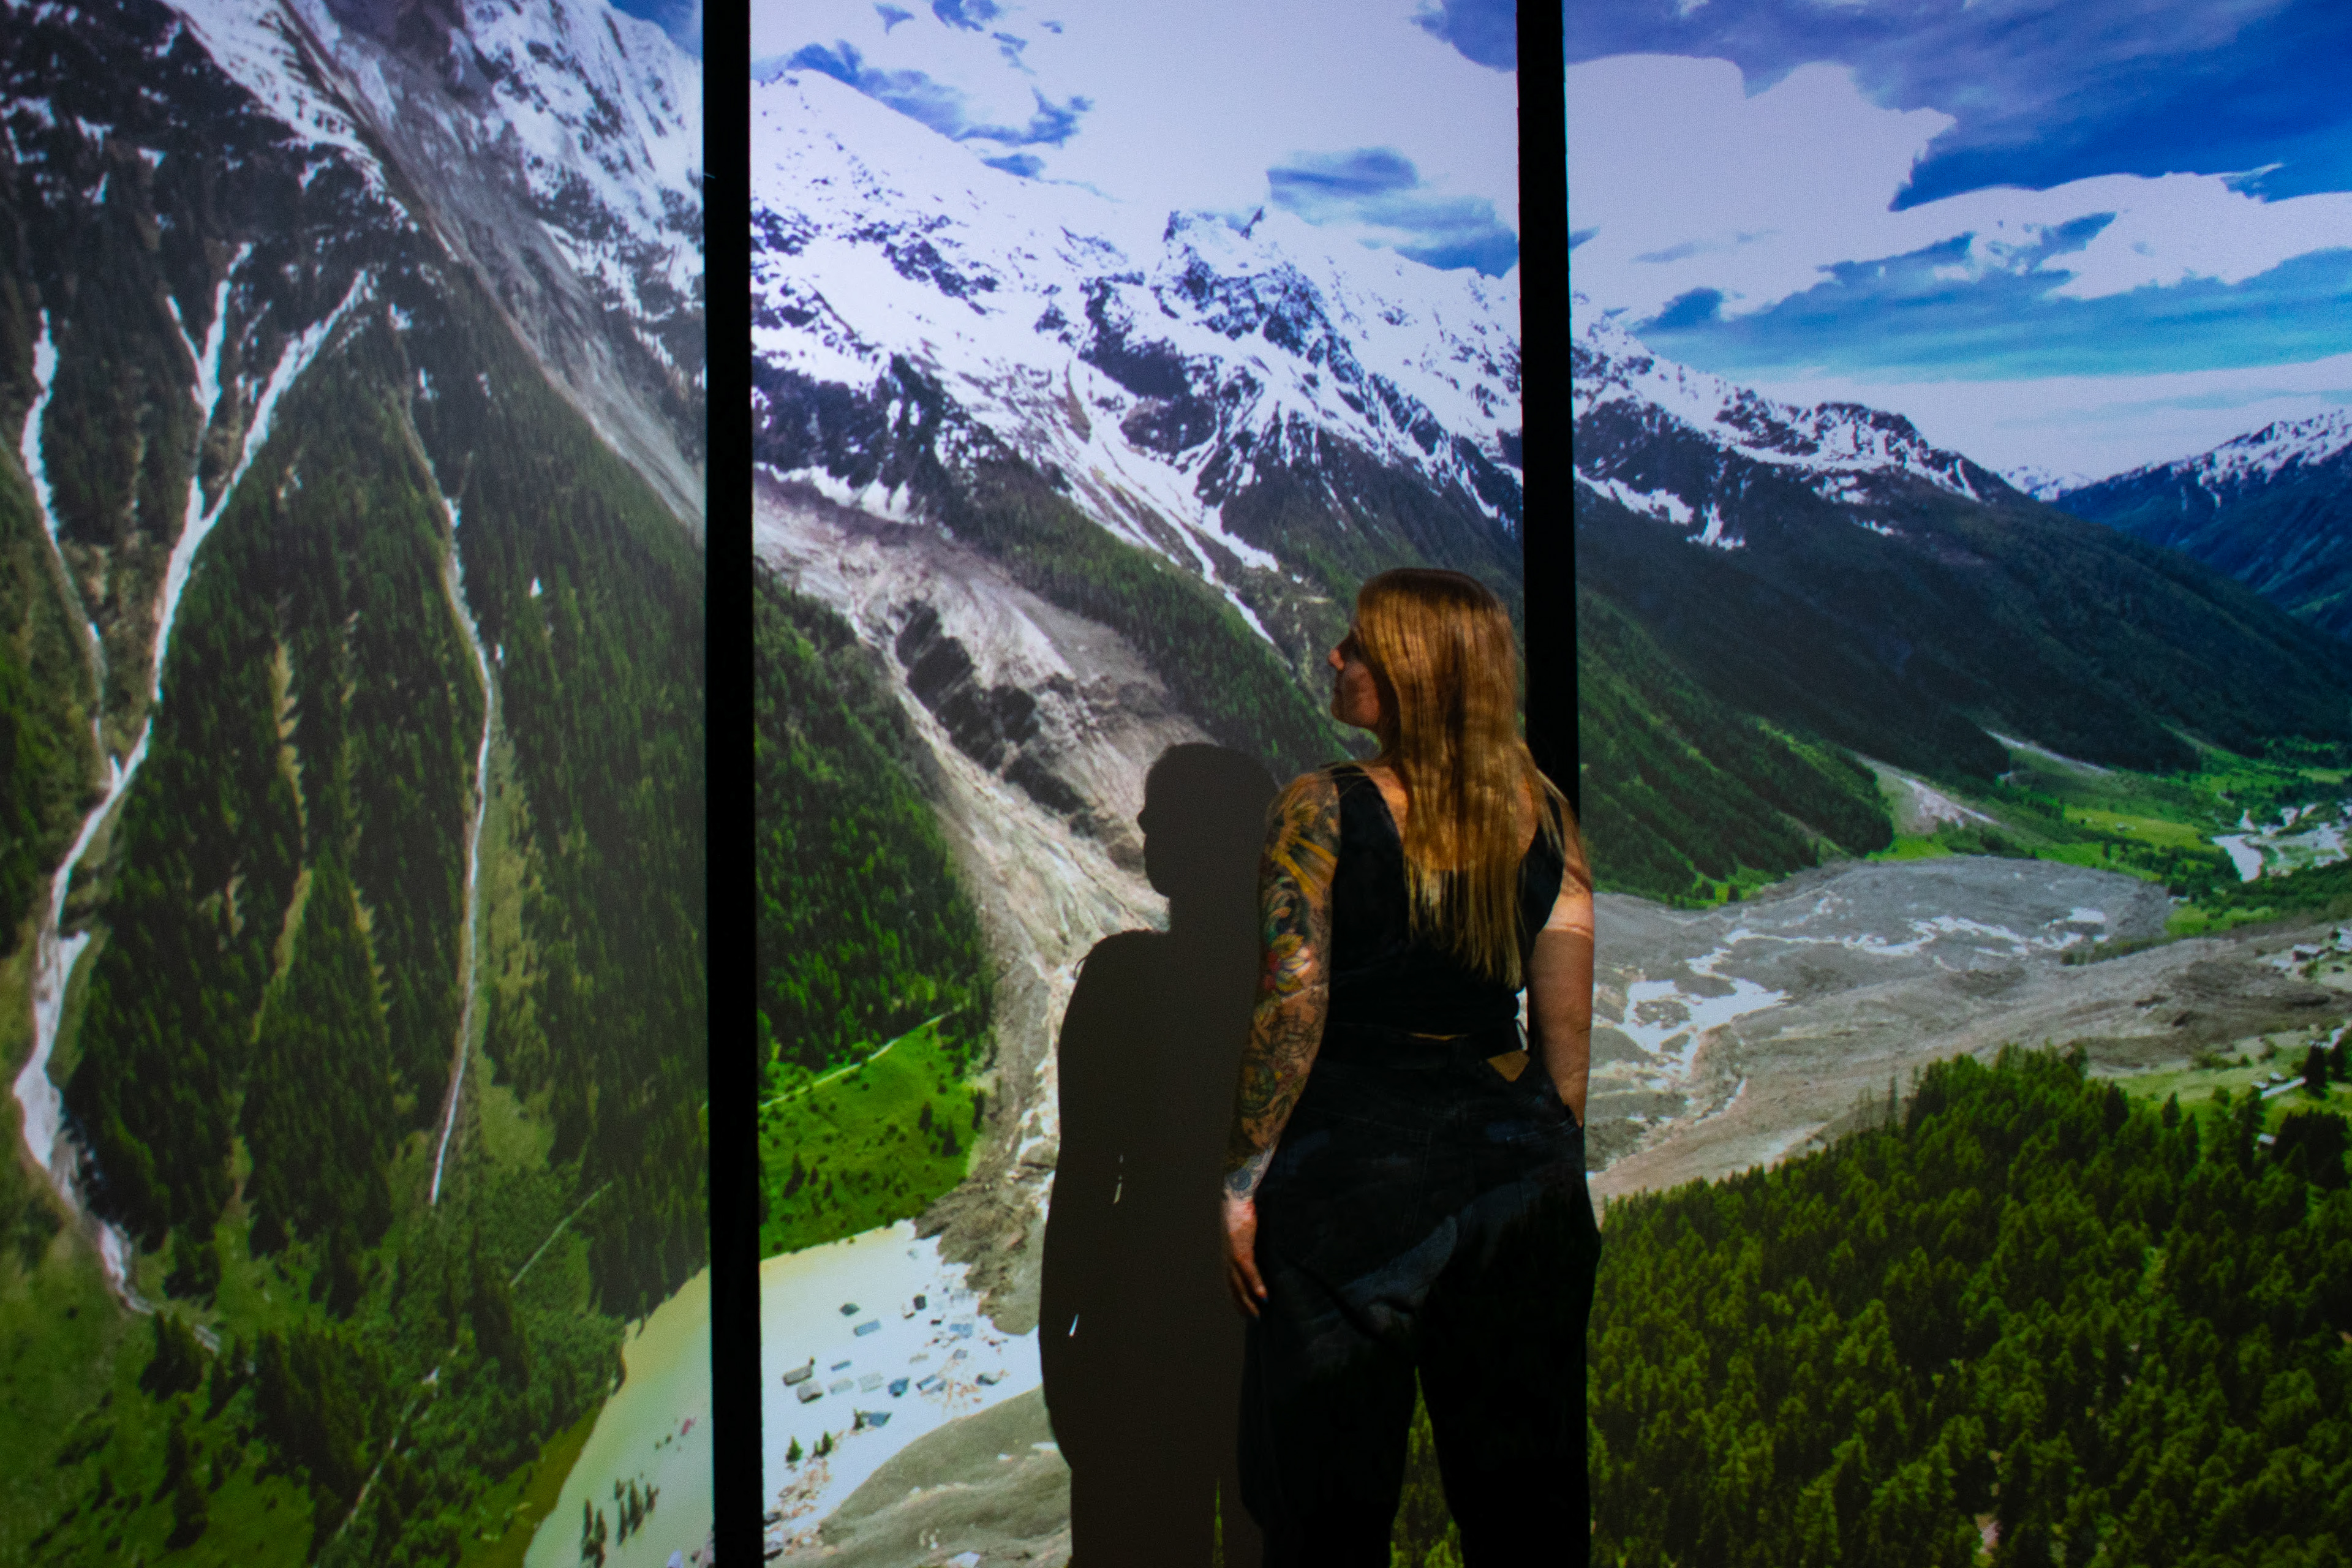
Me in front of the panels
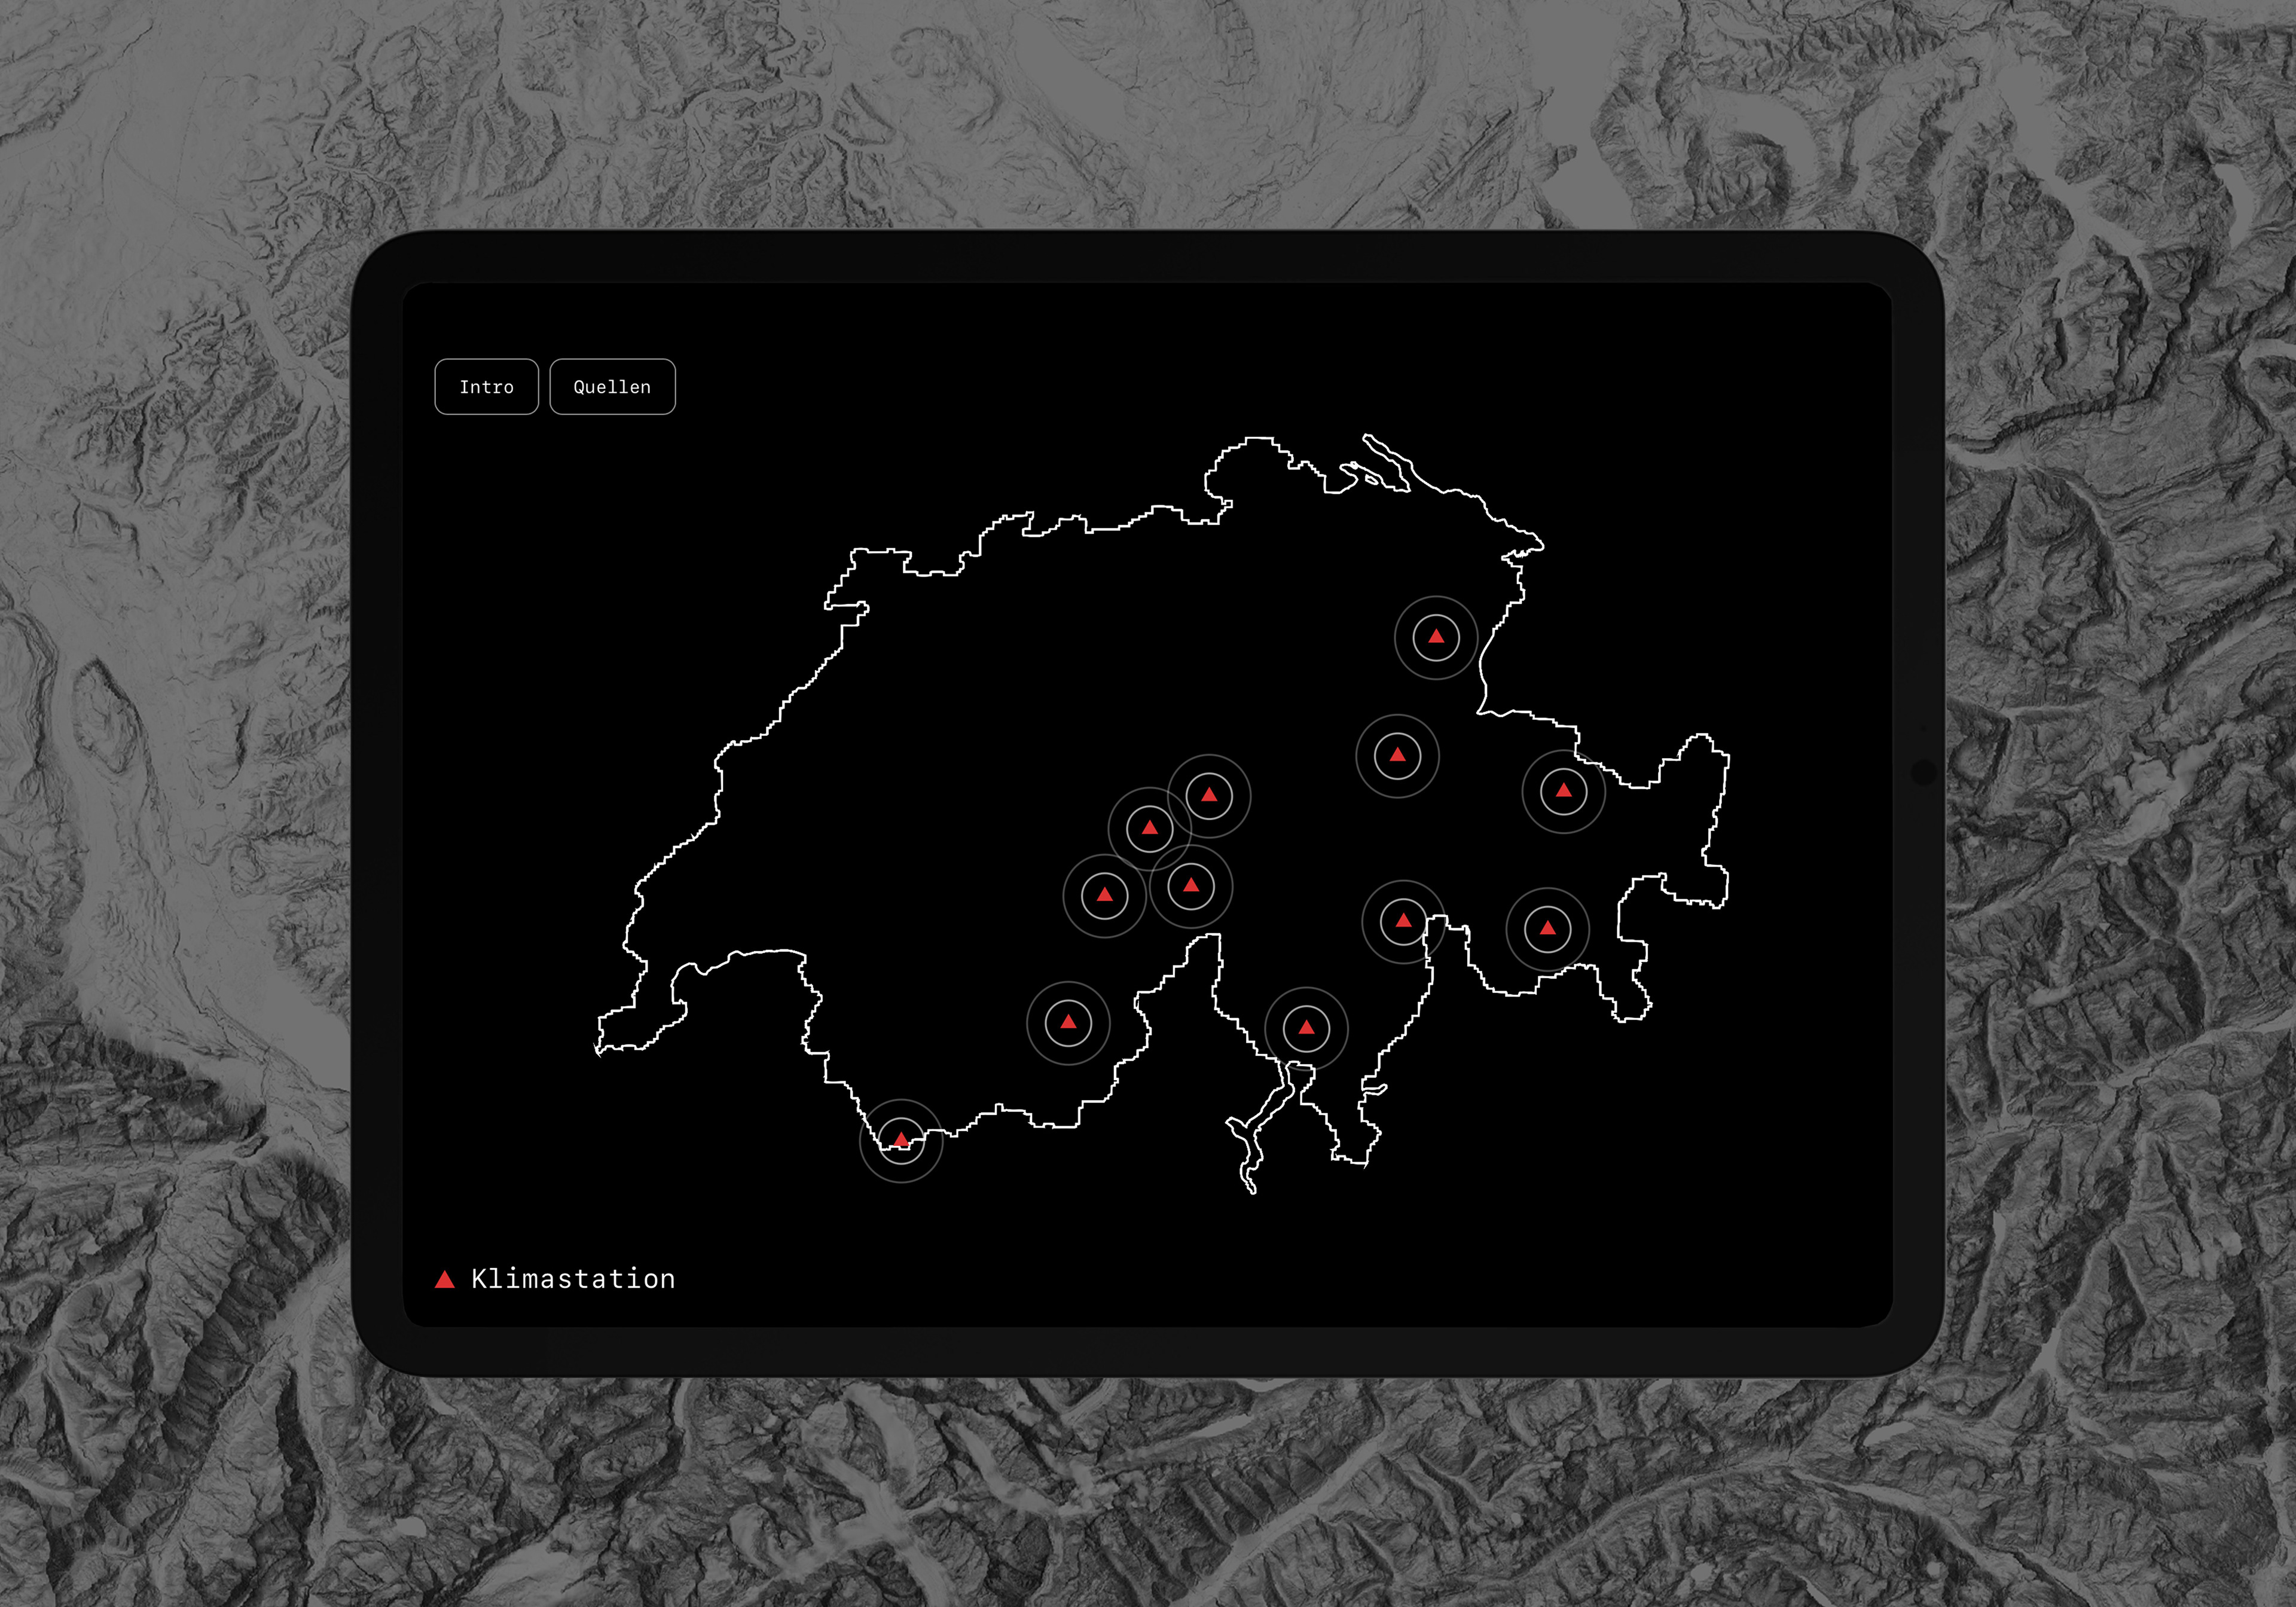
Click on a climate station
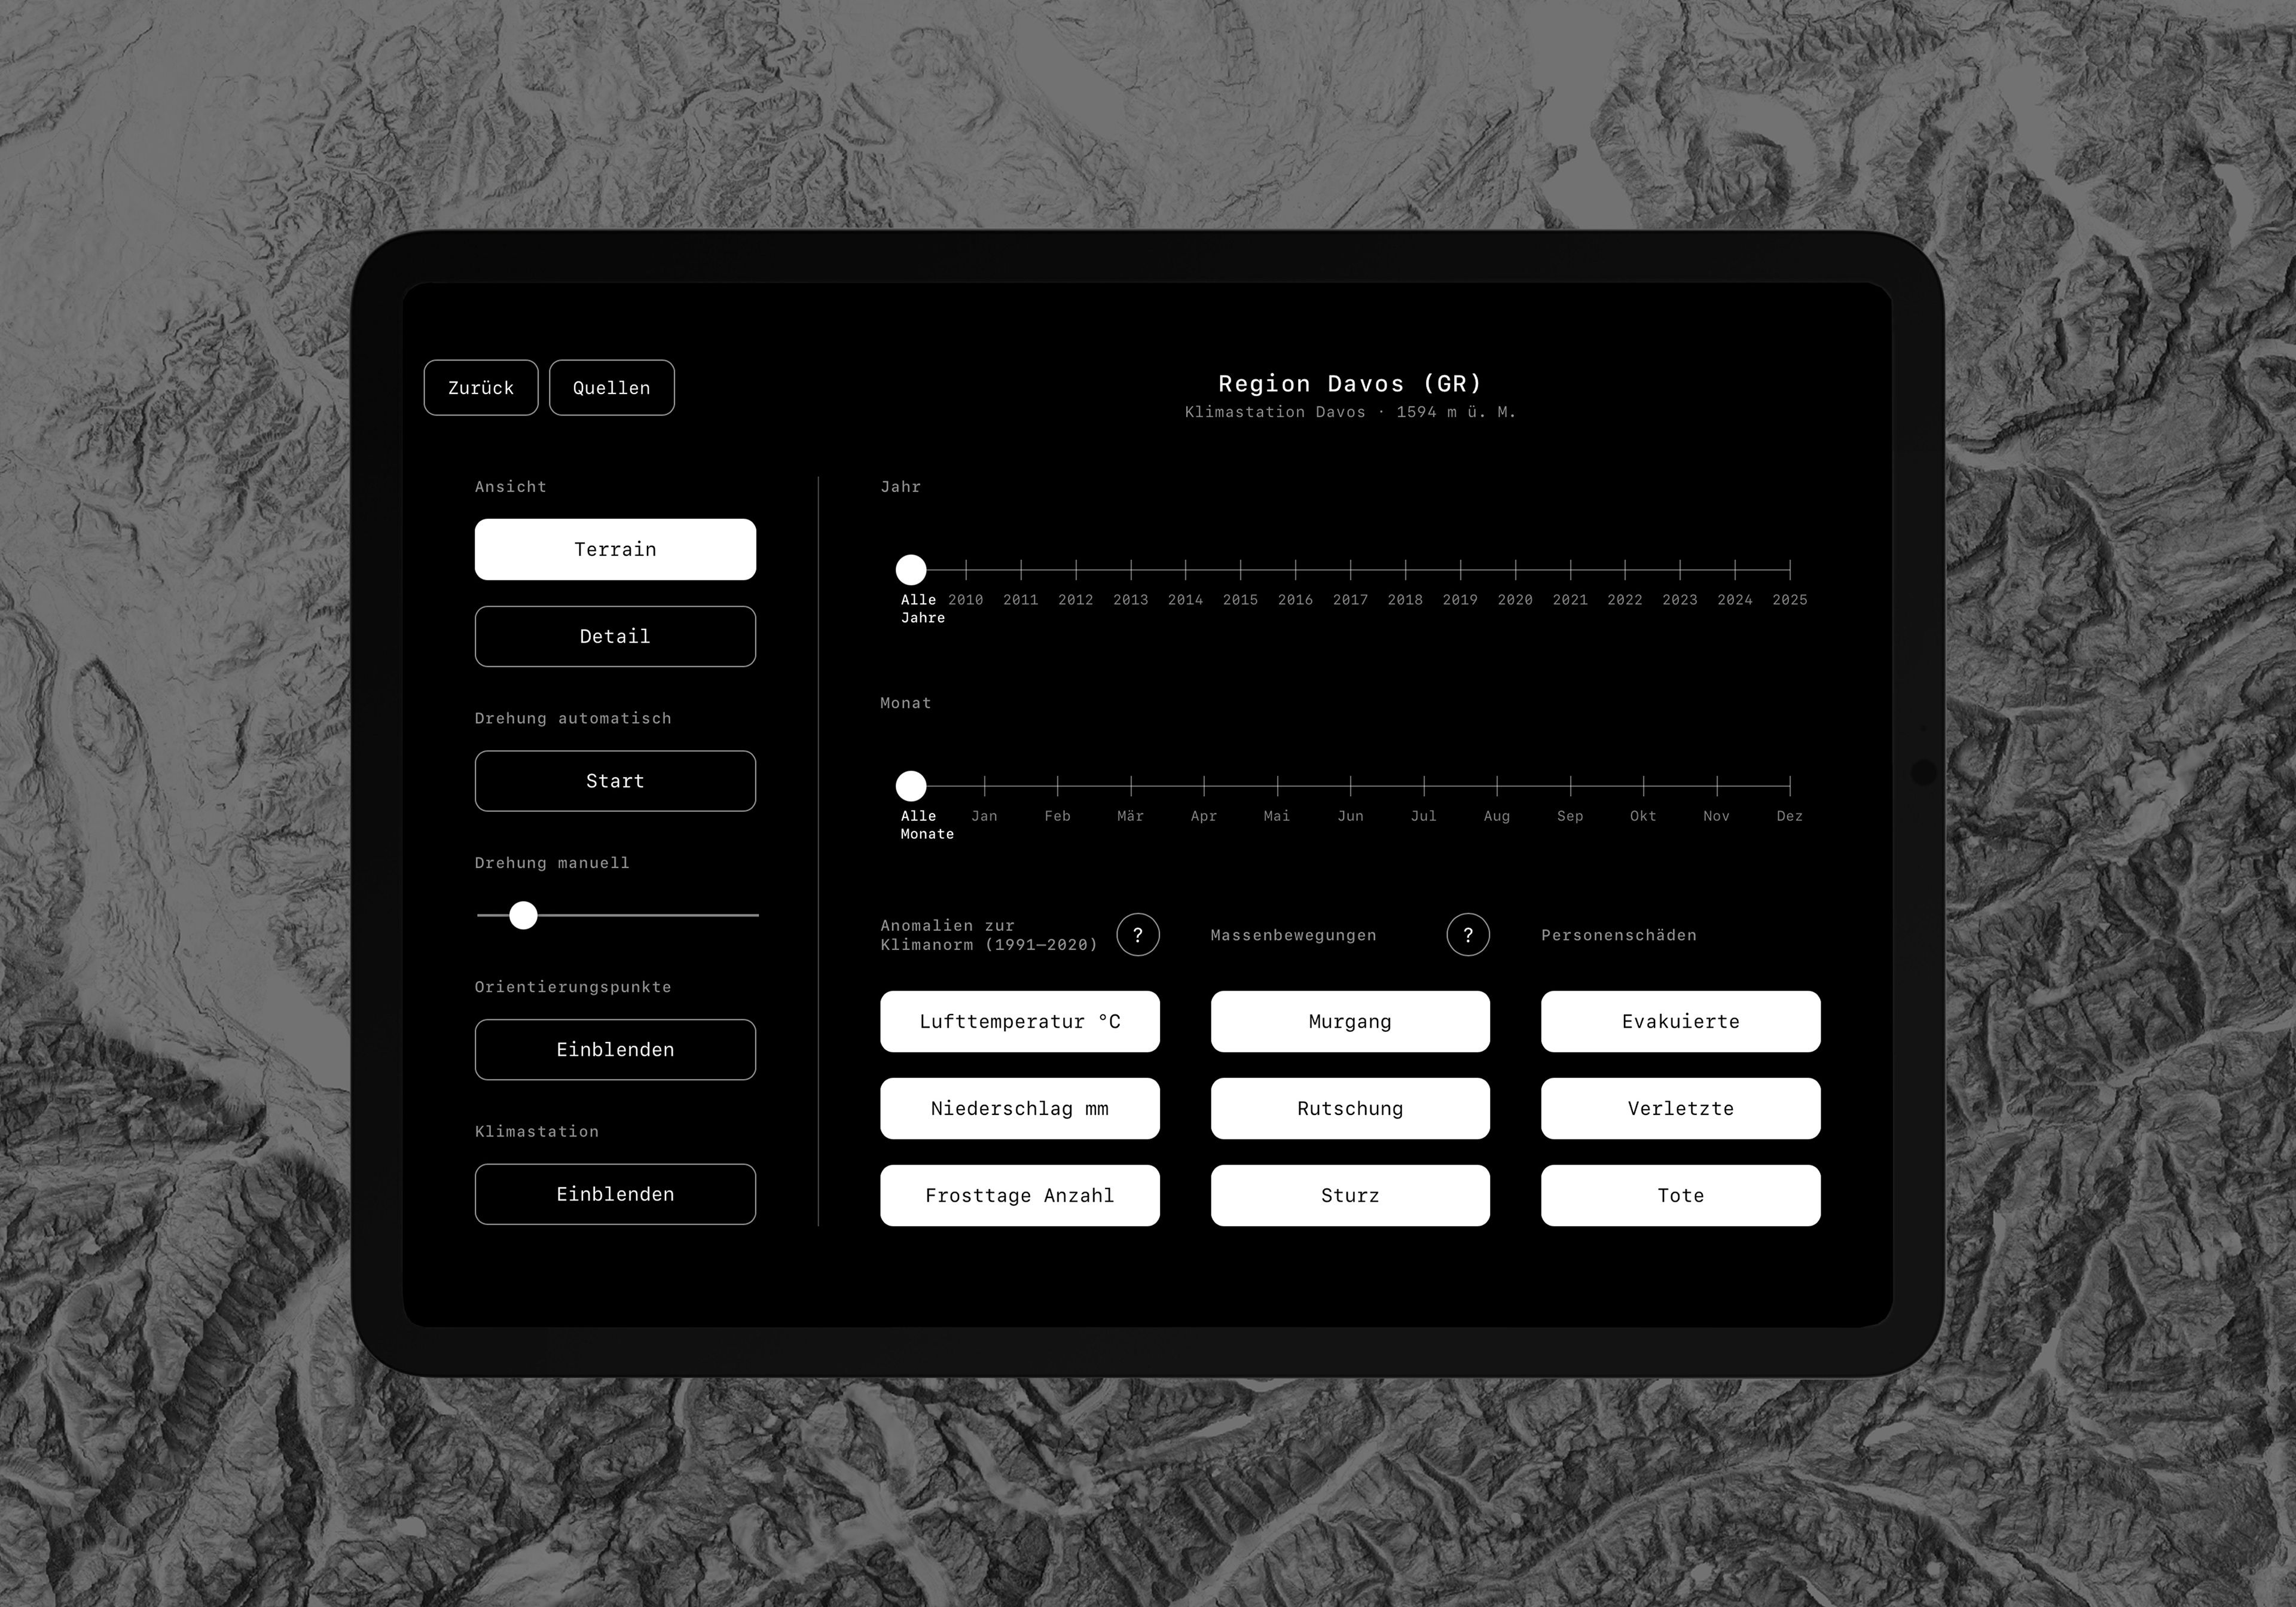
Data Visualization control panel
«flat view» of the station selection
«flat view» of the detail view
«flat view» of the detail view, different station
«flat view» of the terrains
Video, showing the installation and the iPad
(Un)Beständigkeit
Massenbewegungen in der alpinen Schweiz
Autor:in: Danielle Urech, DDA23
DataBook Mentorin: Dr. Phil. Ulrike Felsing
Projekt Fachmentor: Michael Flückiger
BA Data Design + Art, Hochschule Luzern – Design Film Kunst
© HSLU, 2026