Progress pictures
Studentin: Danielle Urech | Dozierende: Darjan Hill, Nicole Lachenmeier
BA Data Design + Art, Hochschule Luzern - Design Film Kunst
© HSLU, 2024
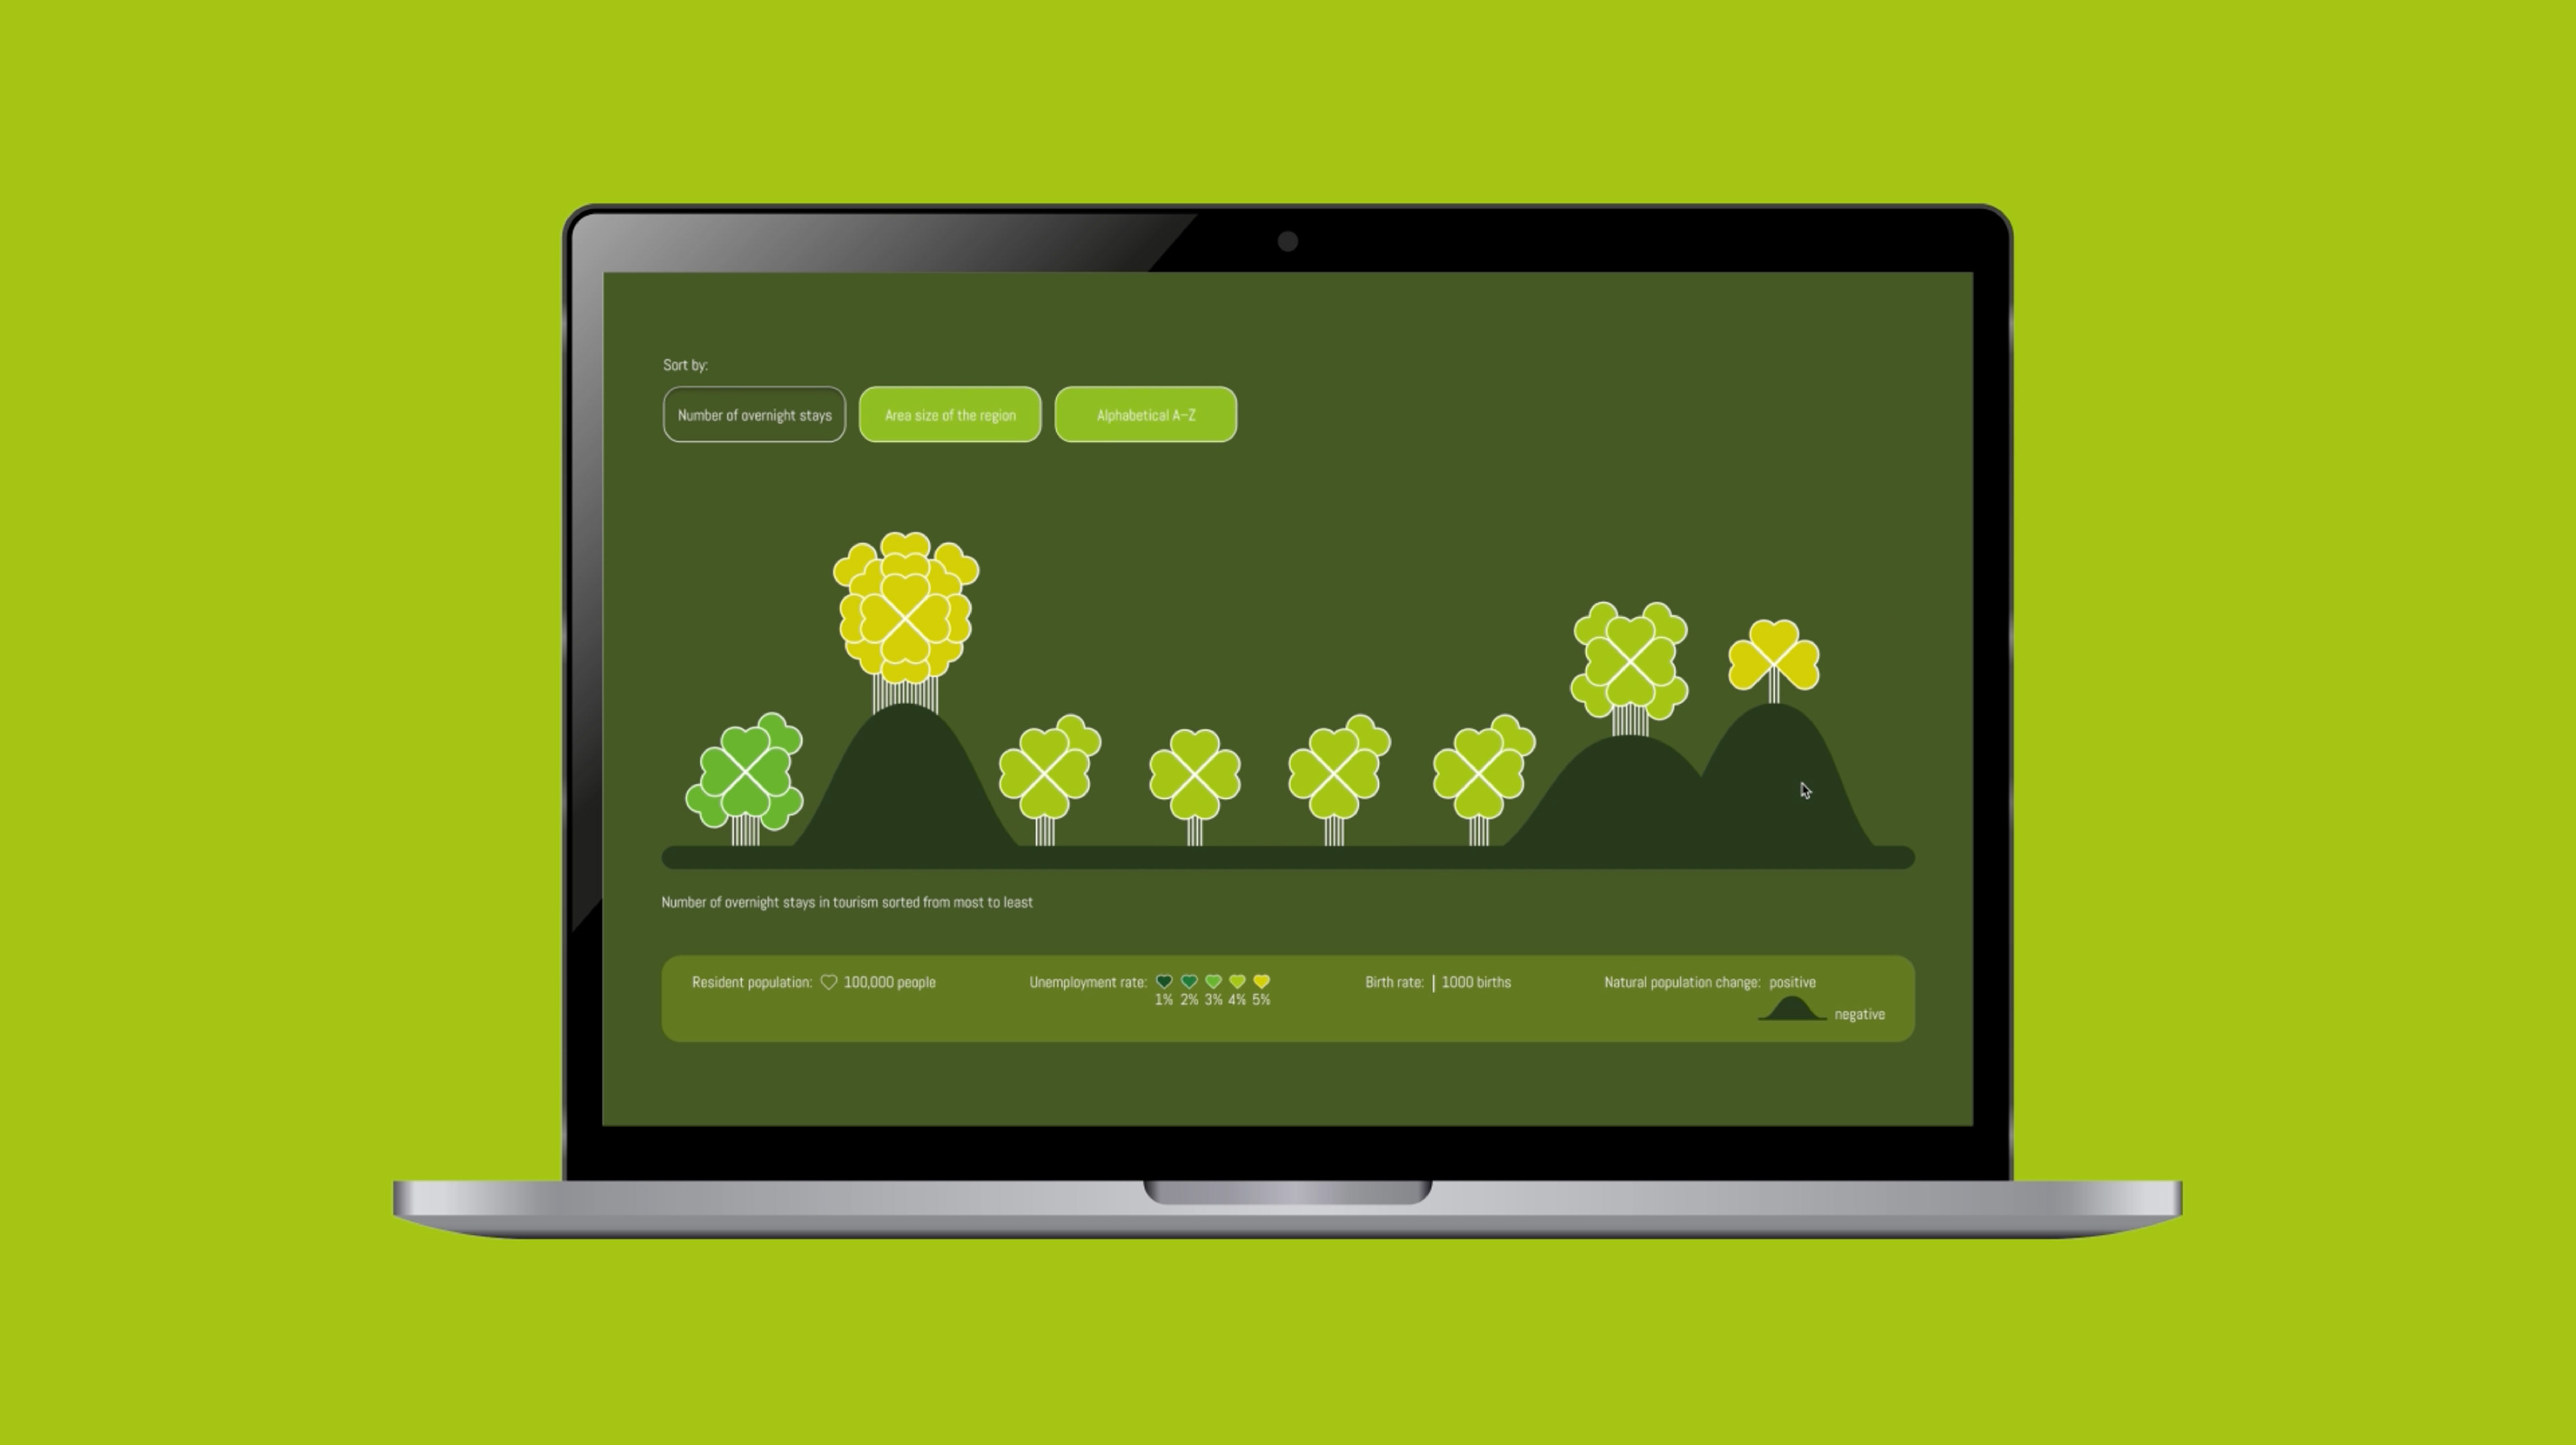
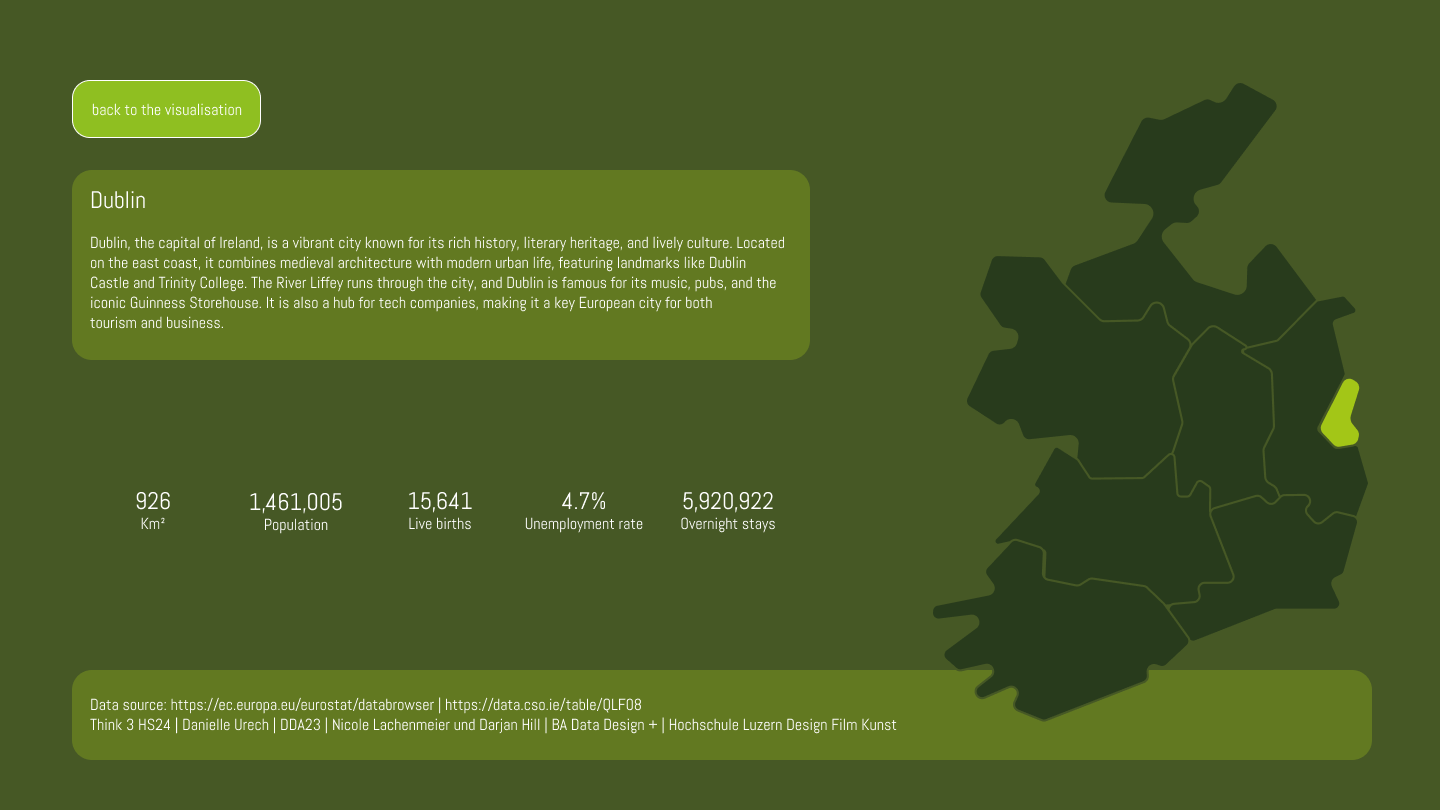
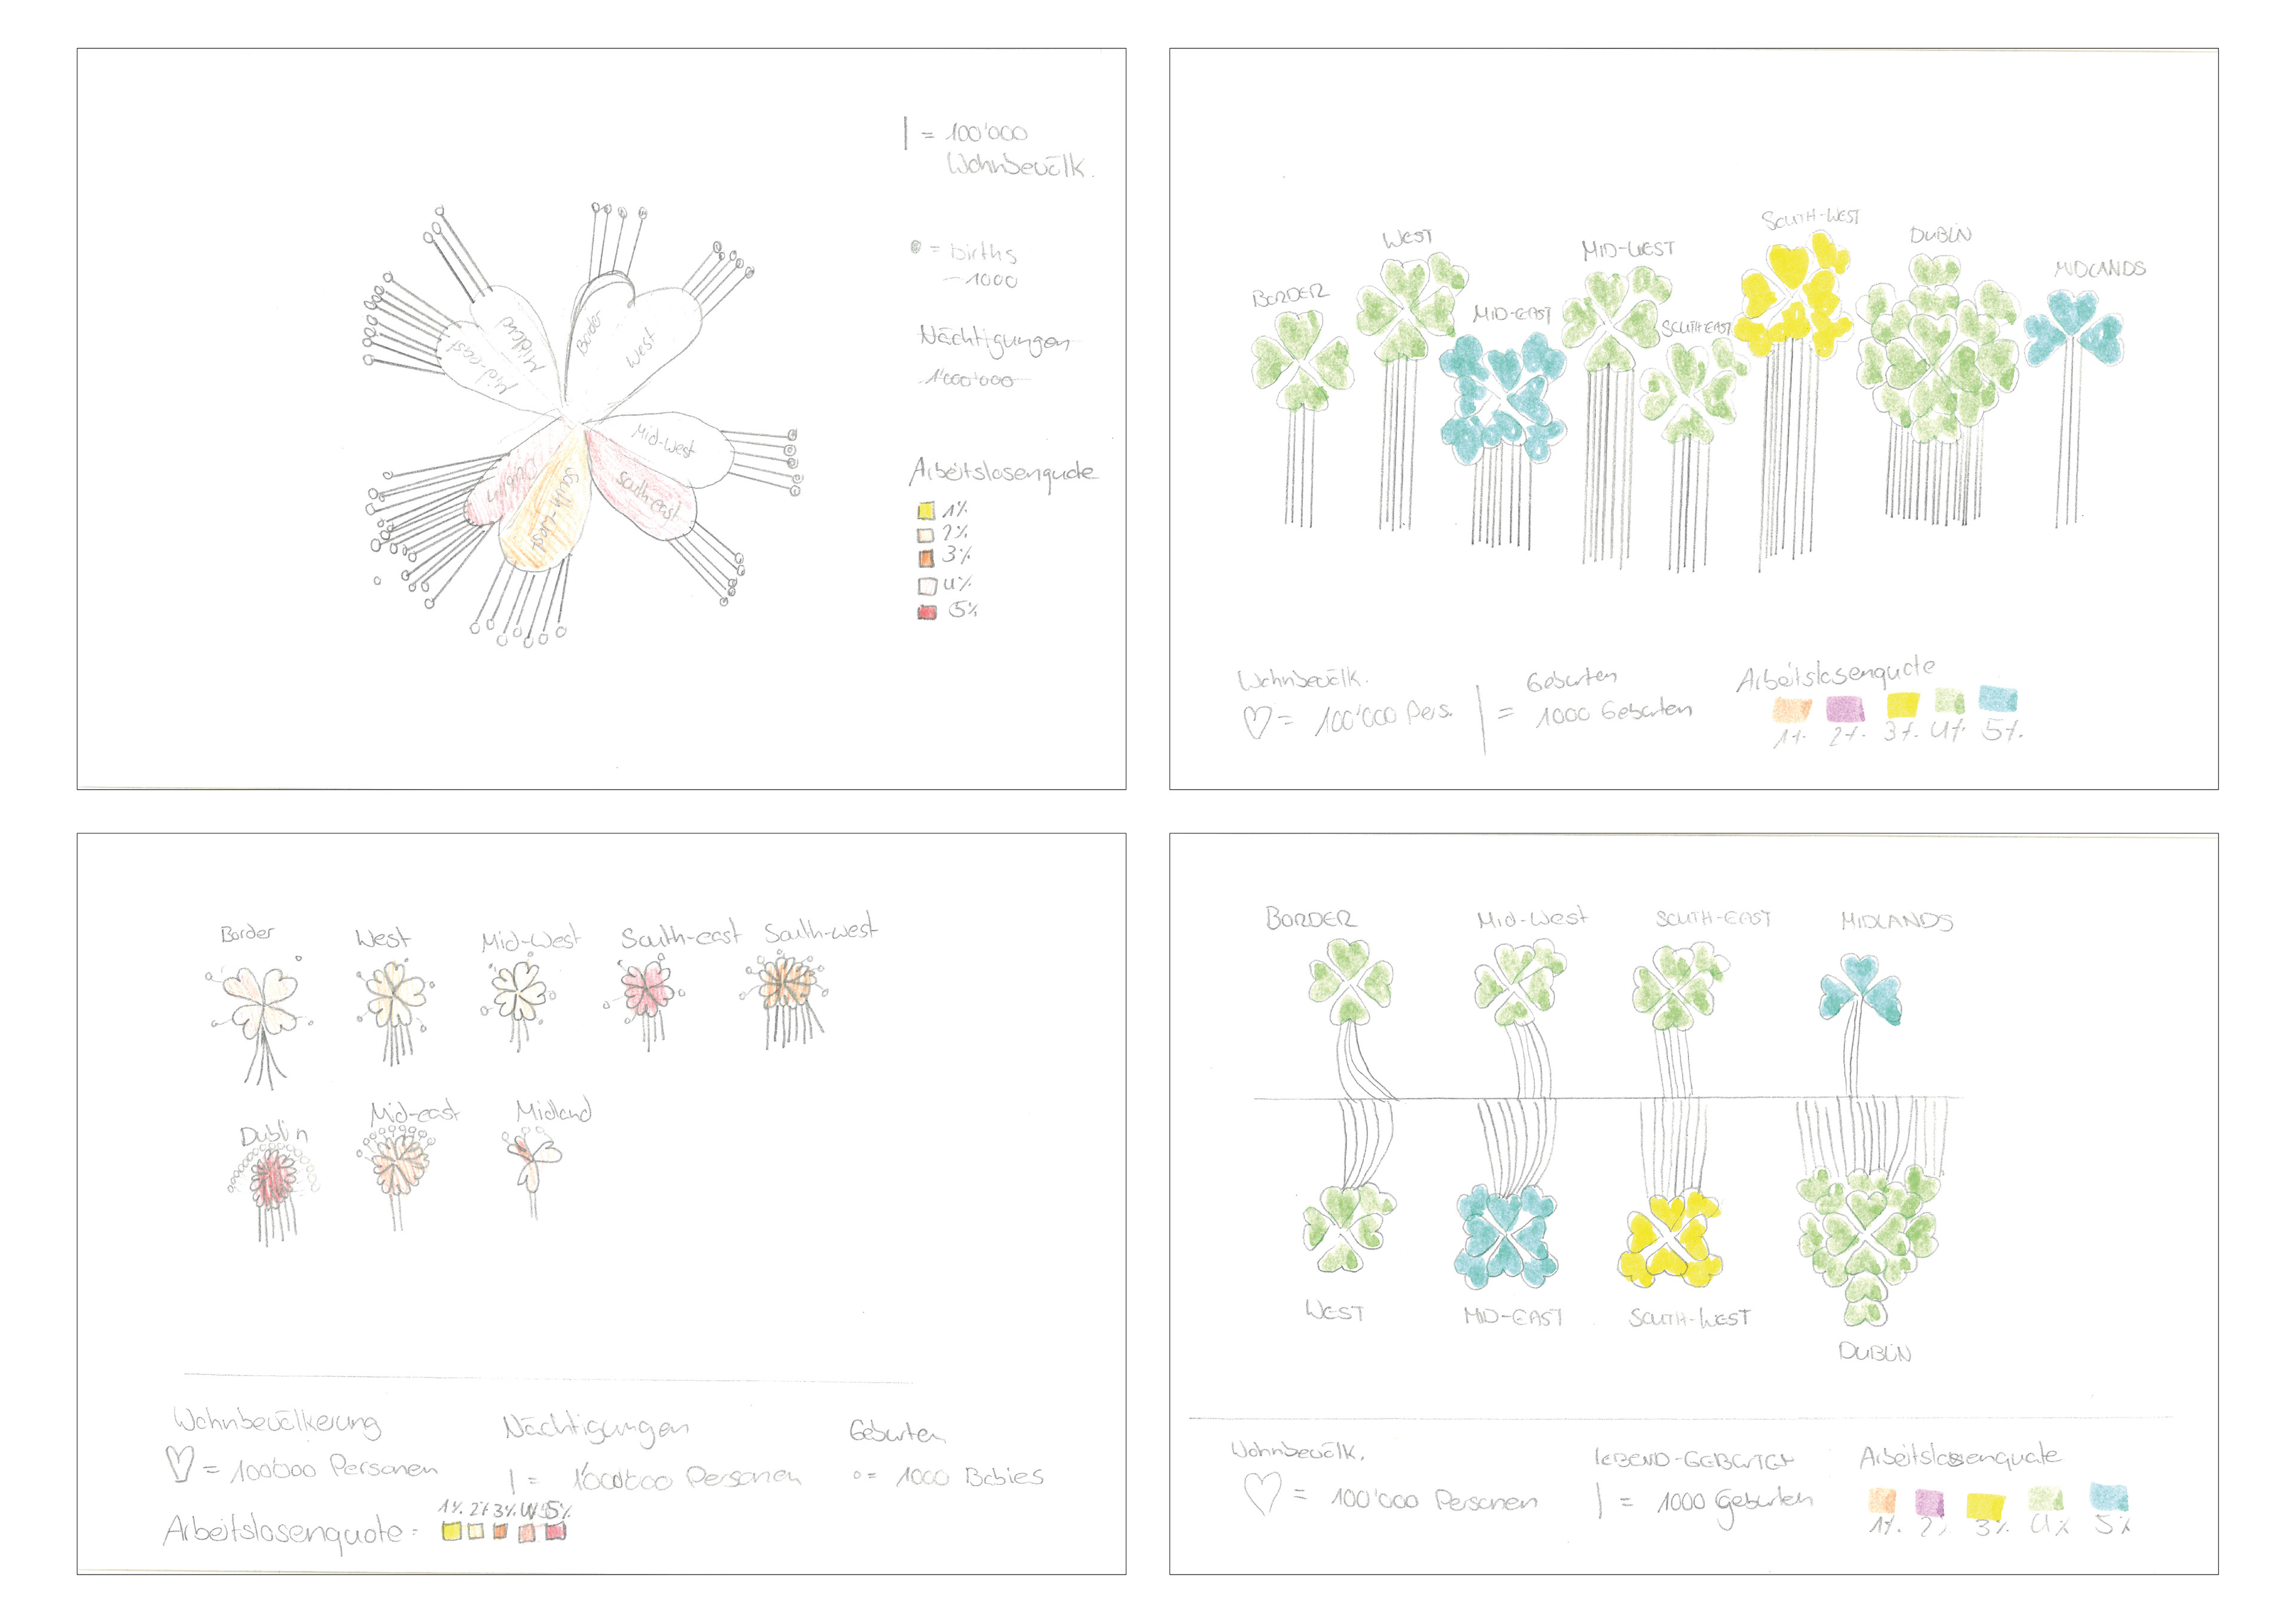
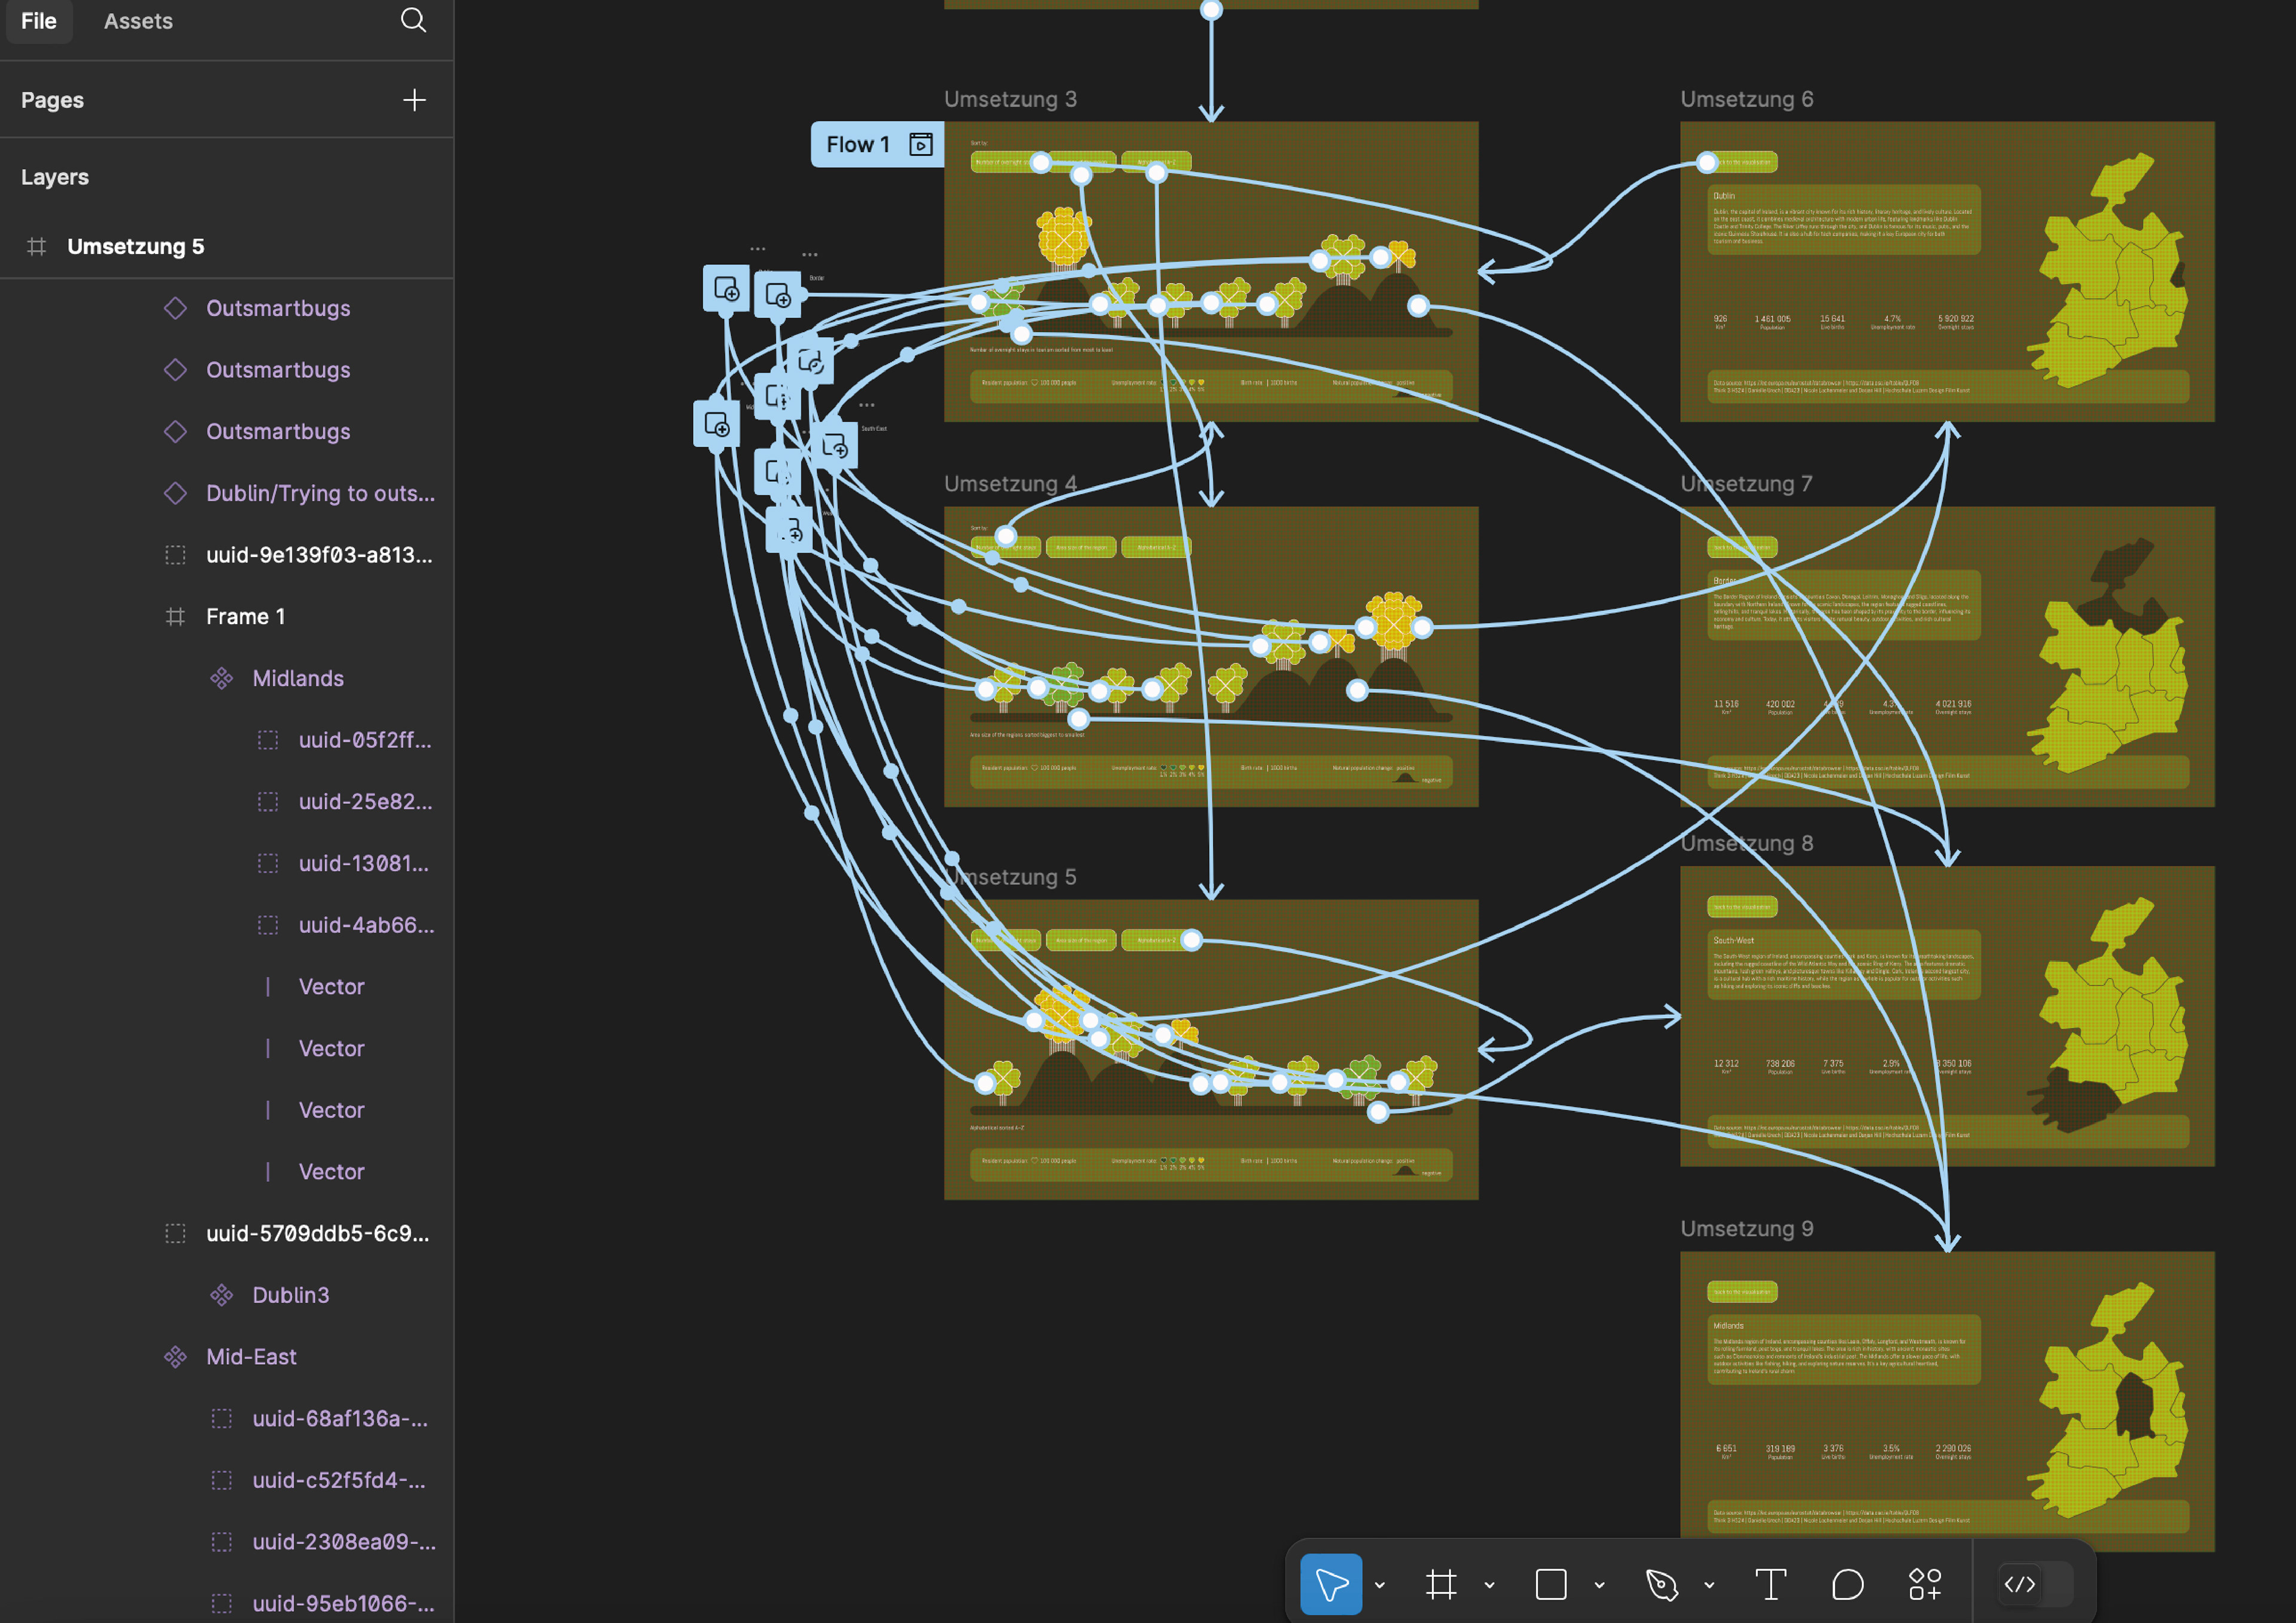
The first module in the second year of Data Design + Art was THINK 3. We had to choose a country and visualize its data in the form of a Figma project. I chose Ireland. To try something new, I wanted to work more with illustration in this project. The data I used comes from 2022. In this visualization, each region is represented by a cloverleaf. One leaf represents 100,000 people (population); the colors indicate the unemployment rate (1–5%, with lighter tones showing higher rates). A stem stands for 1,000 births, and if the clover is positioned on a hill, it means the natural population growth was positive (if not, it was negative). The visualization can be sorted by the number of overnight stays (hotels), by area, or alphabetically. When hovering over a clover, the region’s name appears. Clicking on the grass below opens a detail page with further information about the selected region.