Full Click-Through
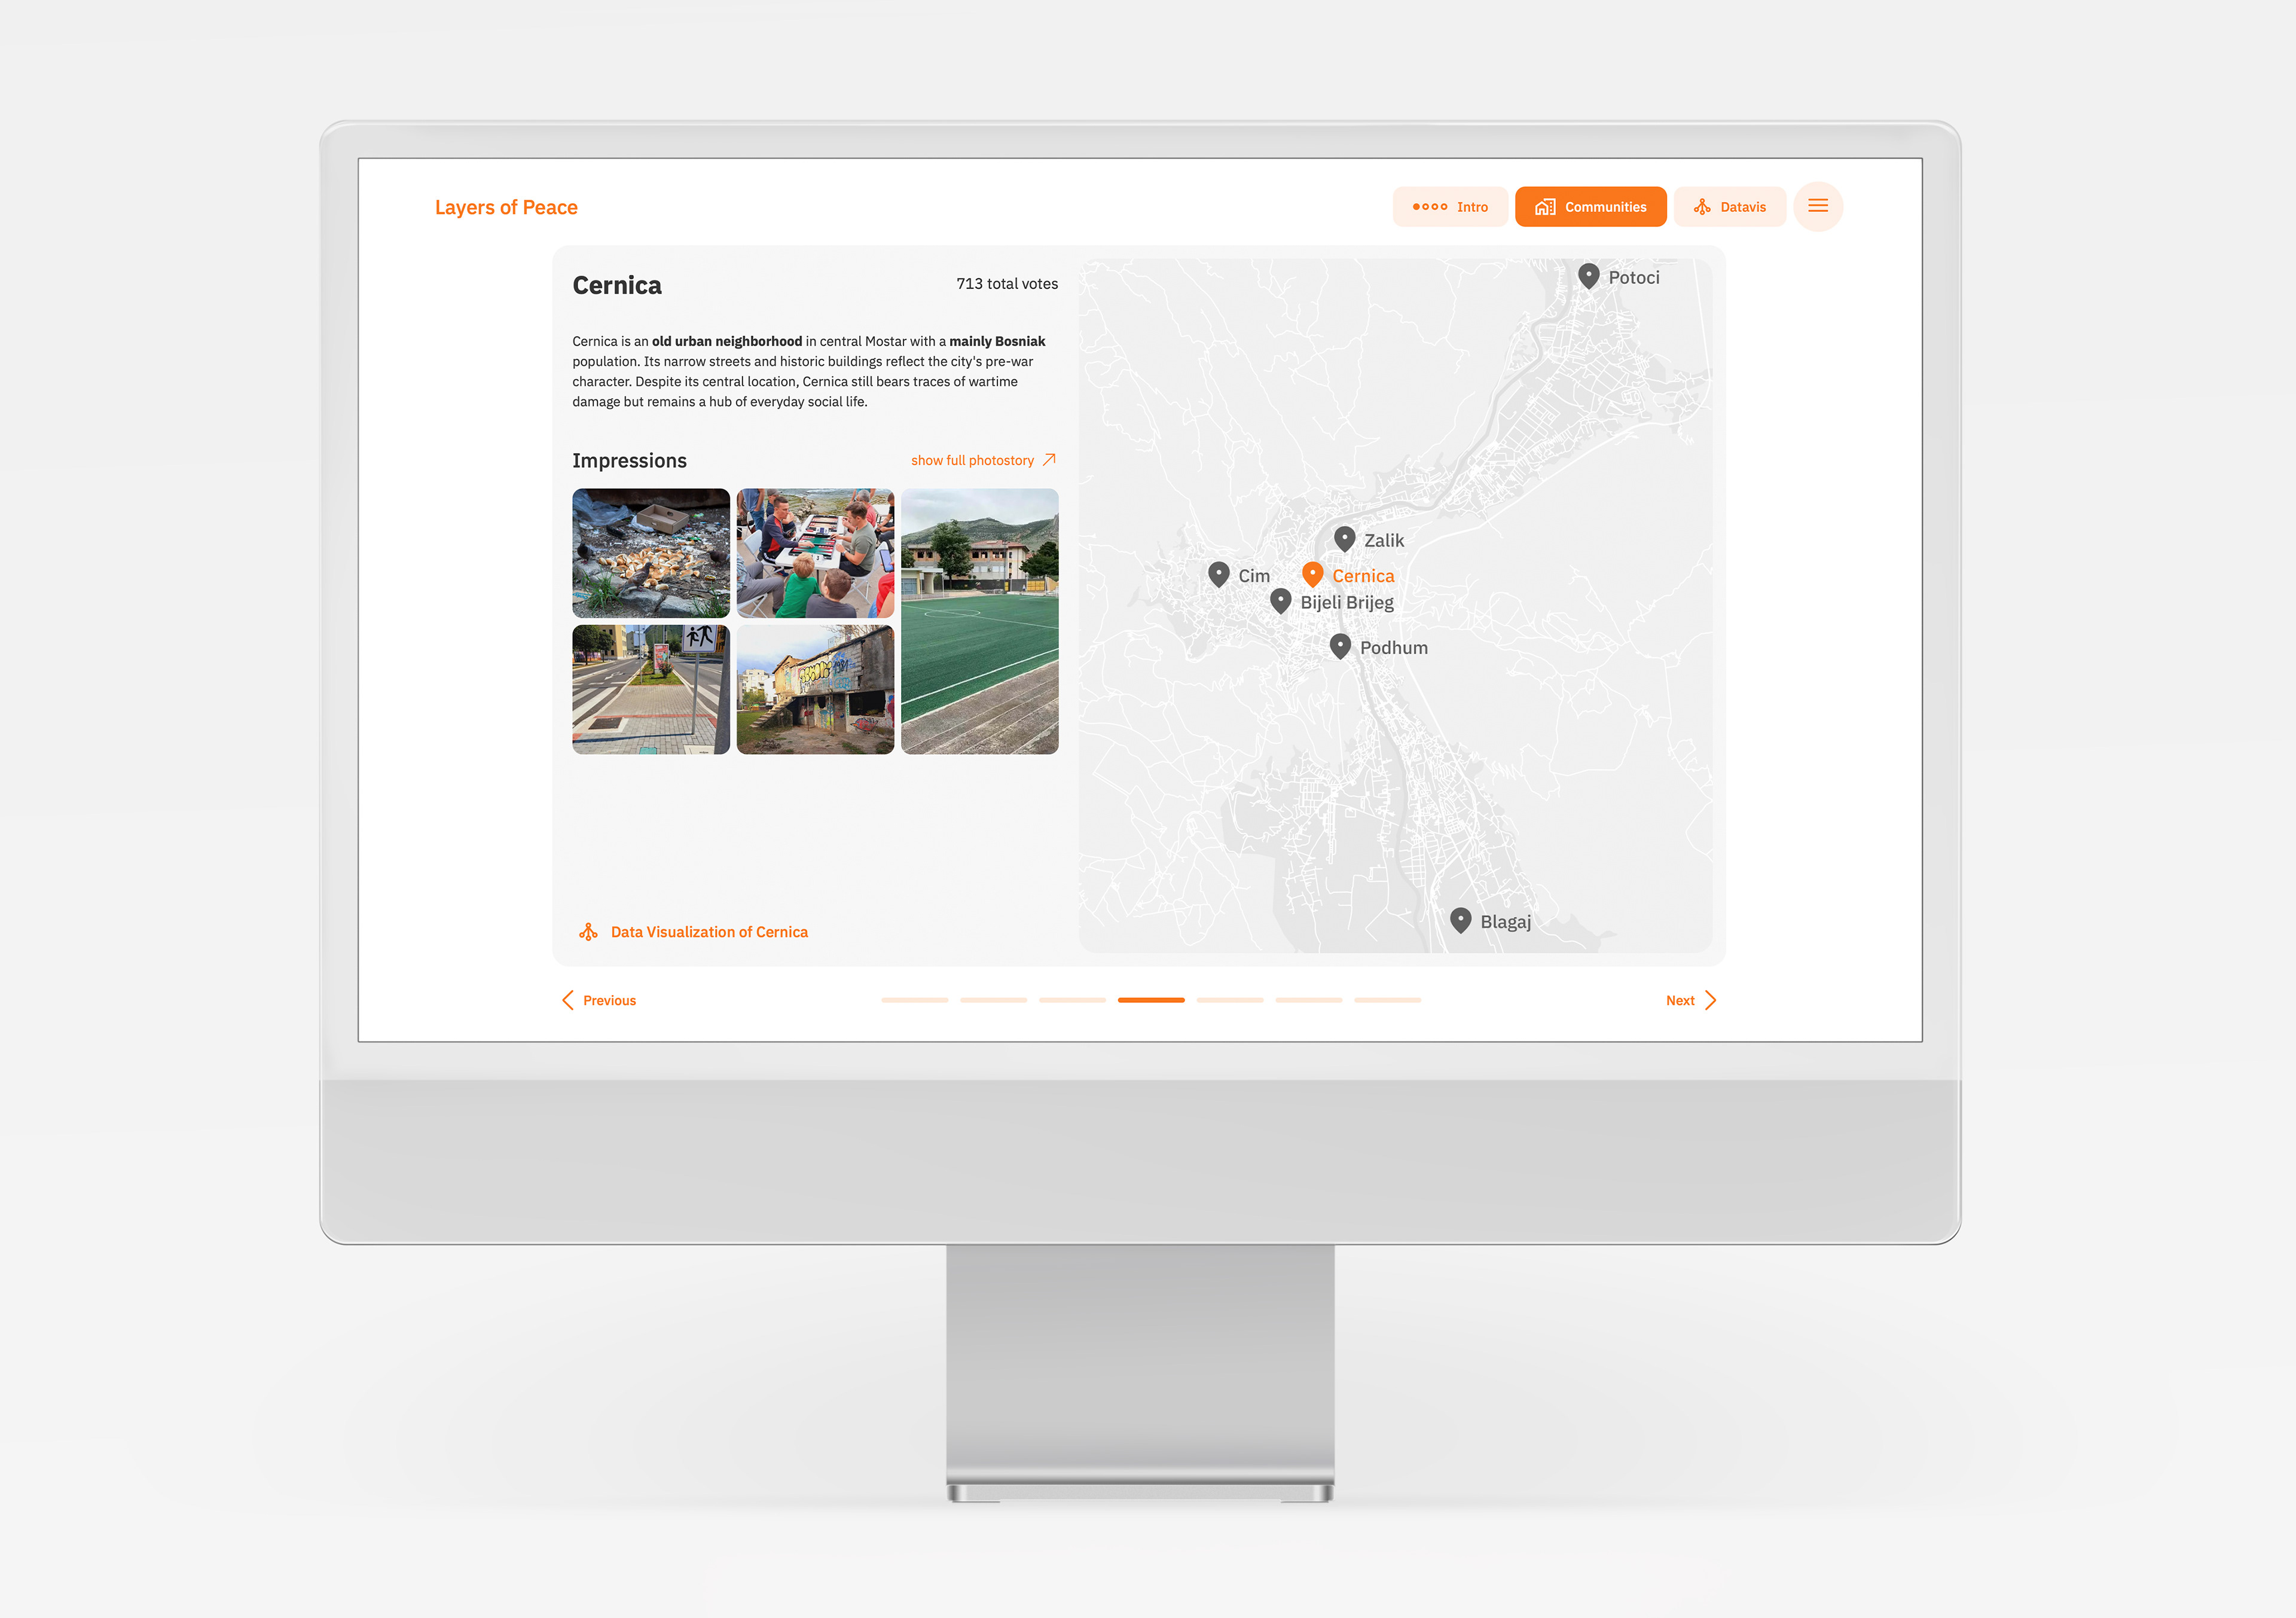
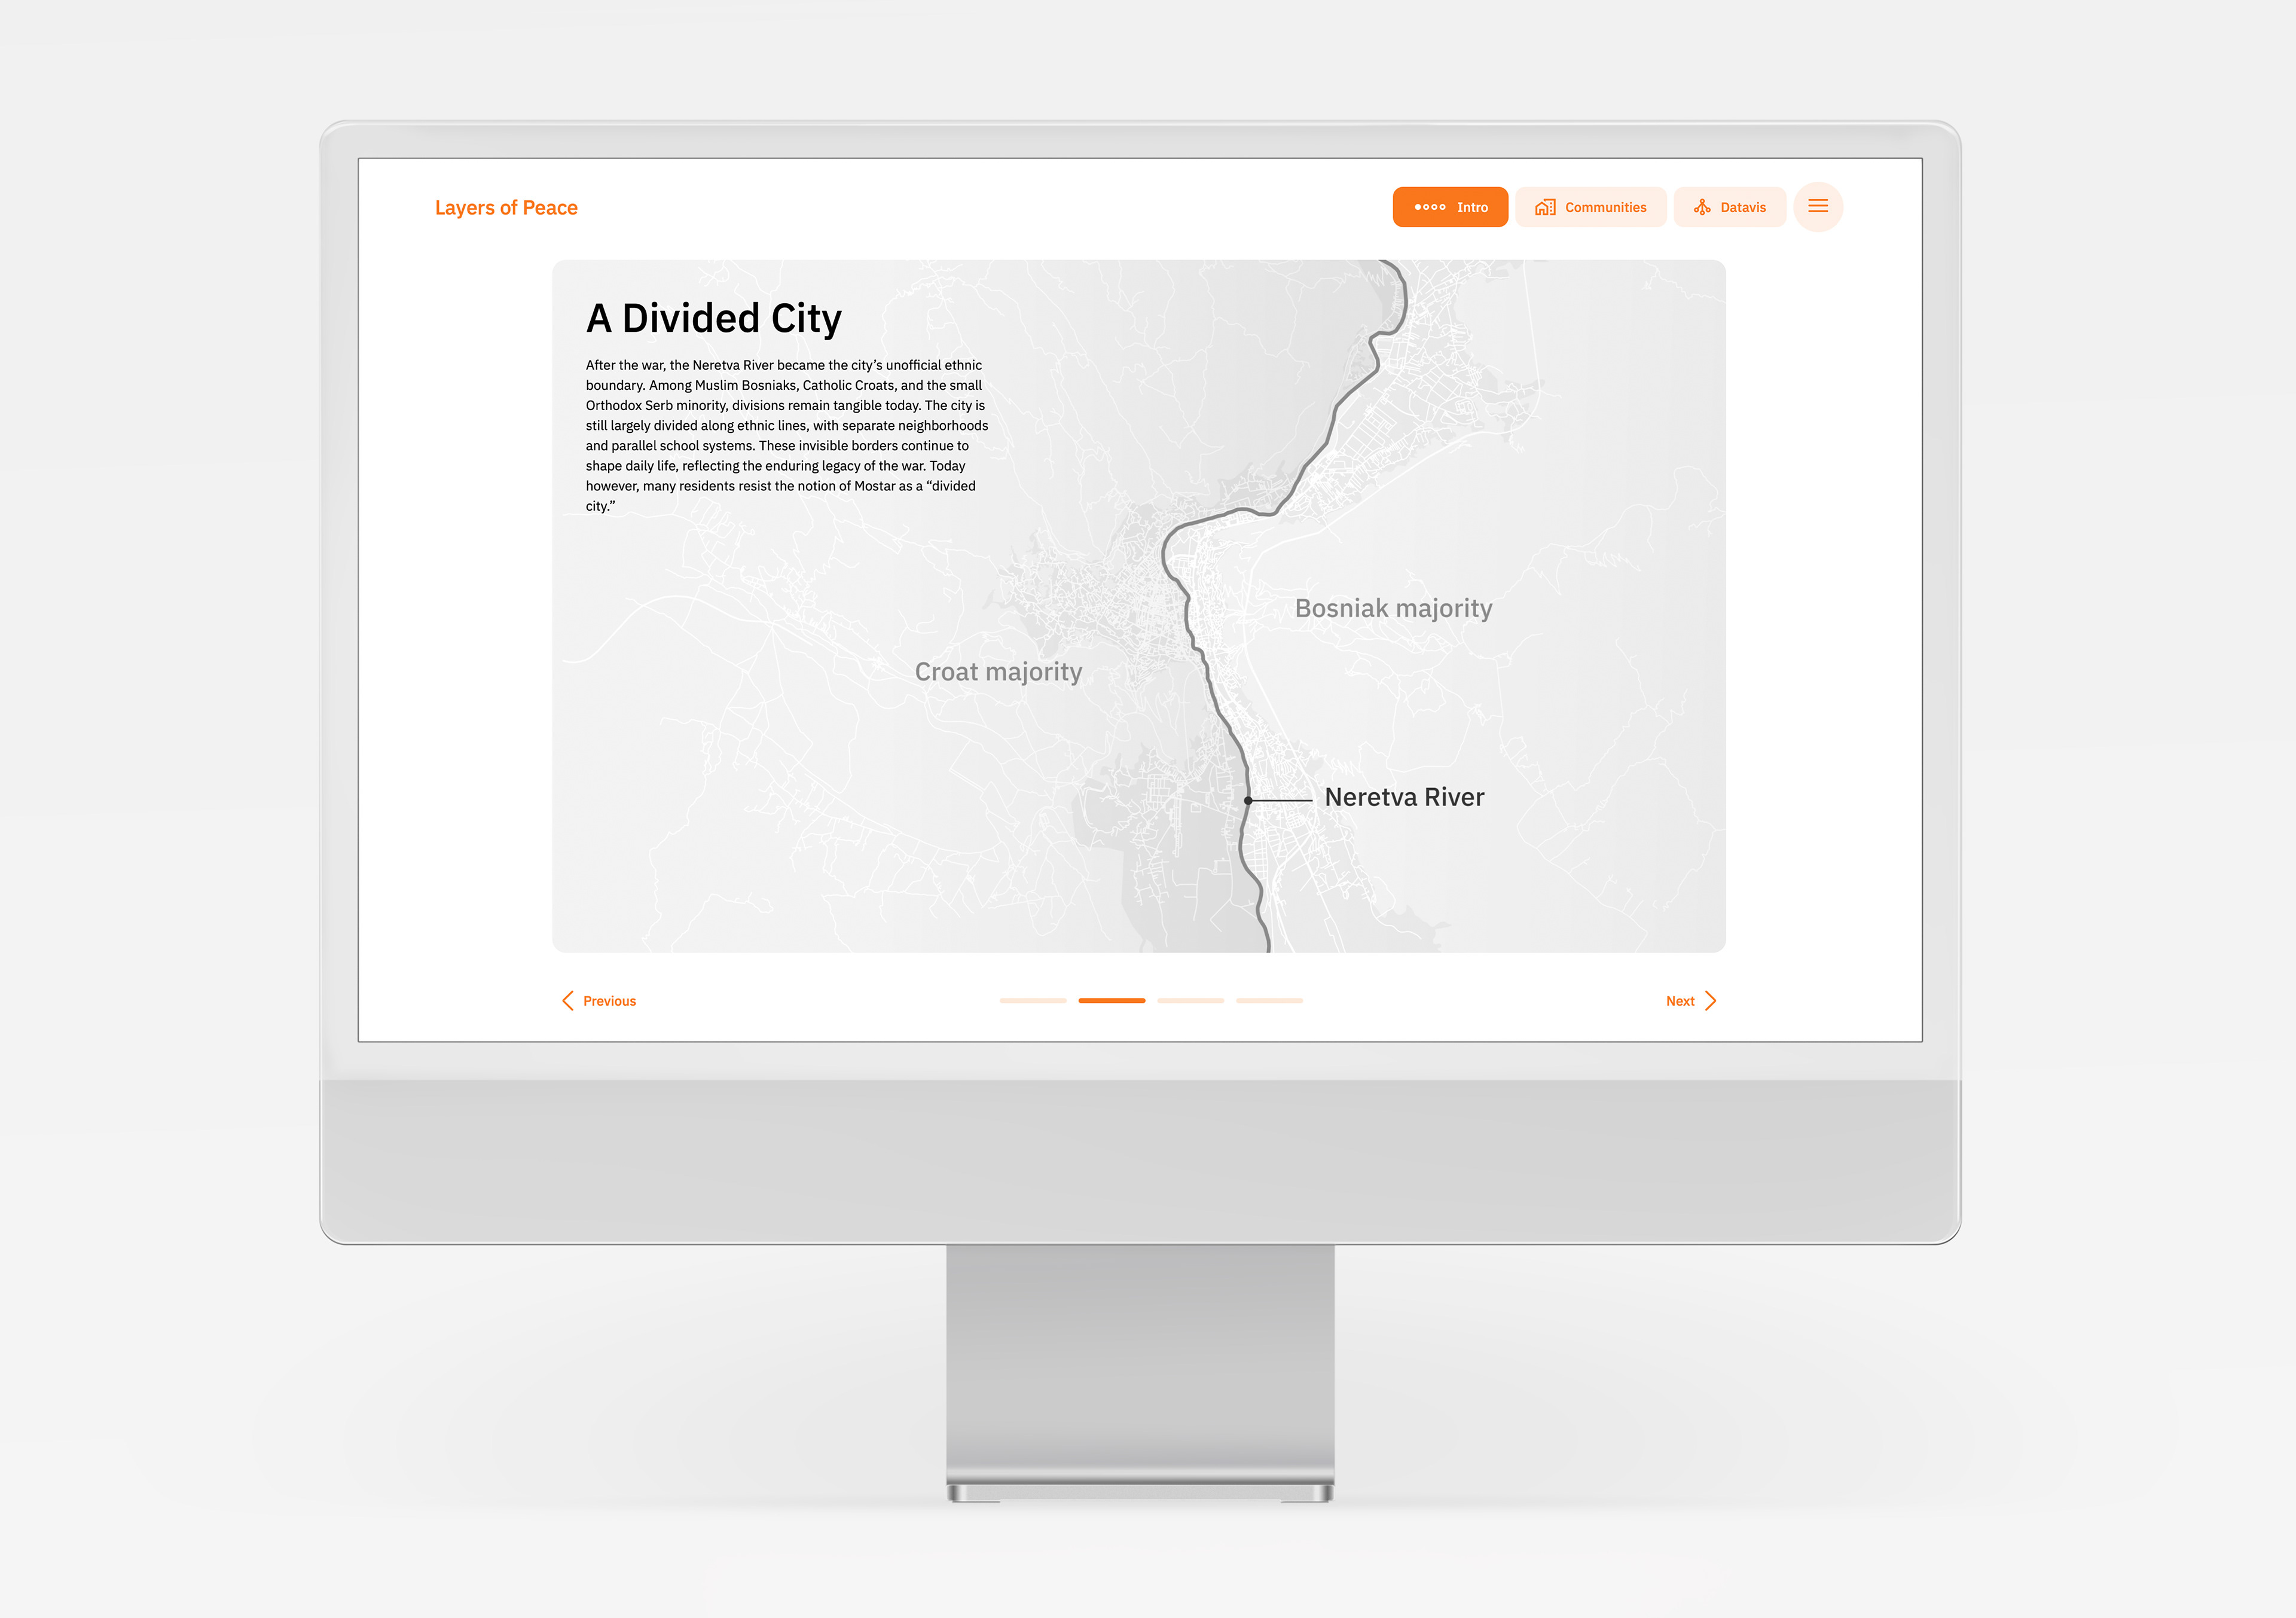
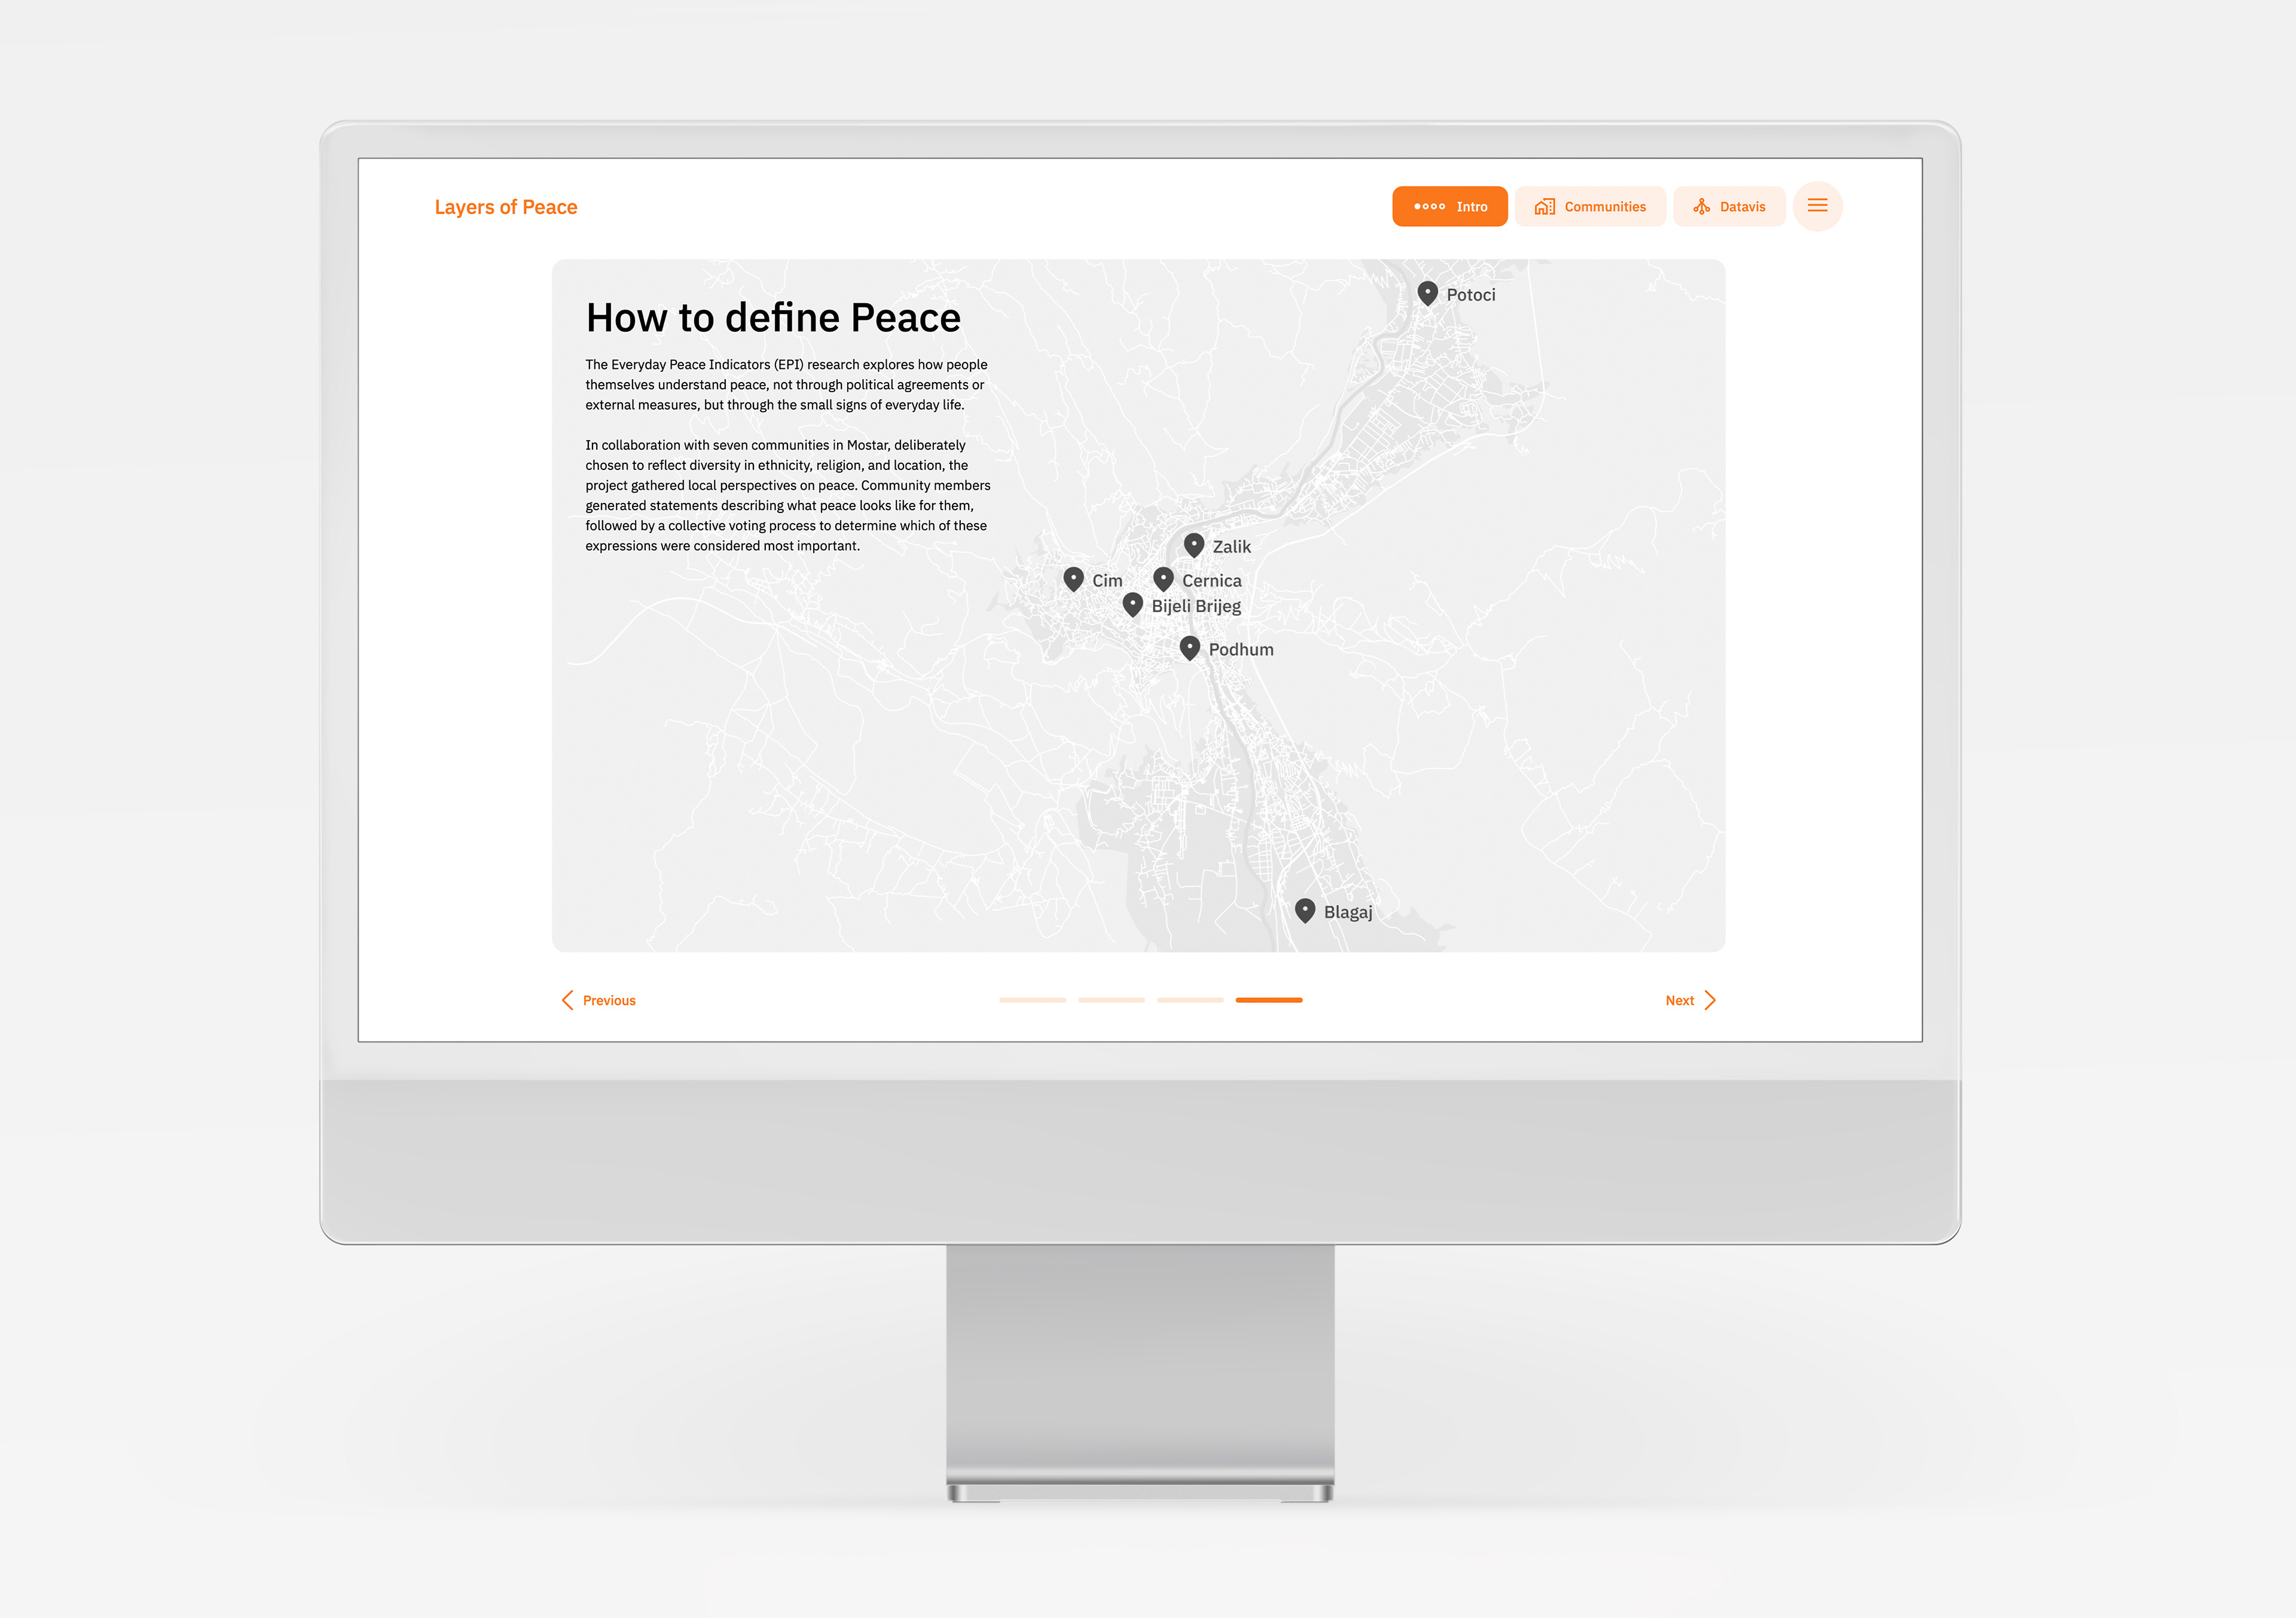
Stills final Website
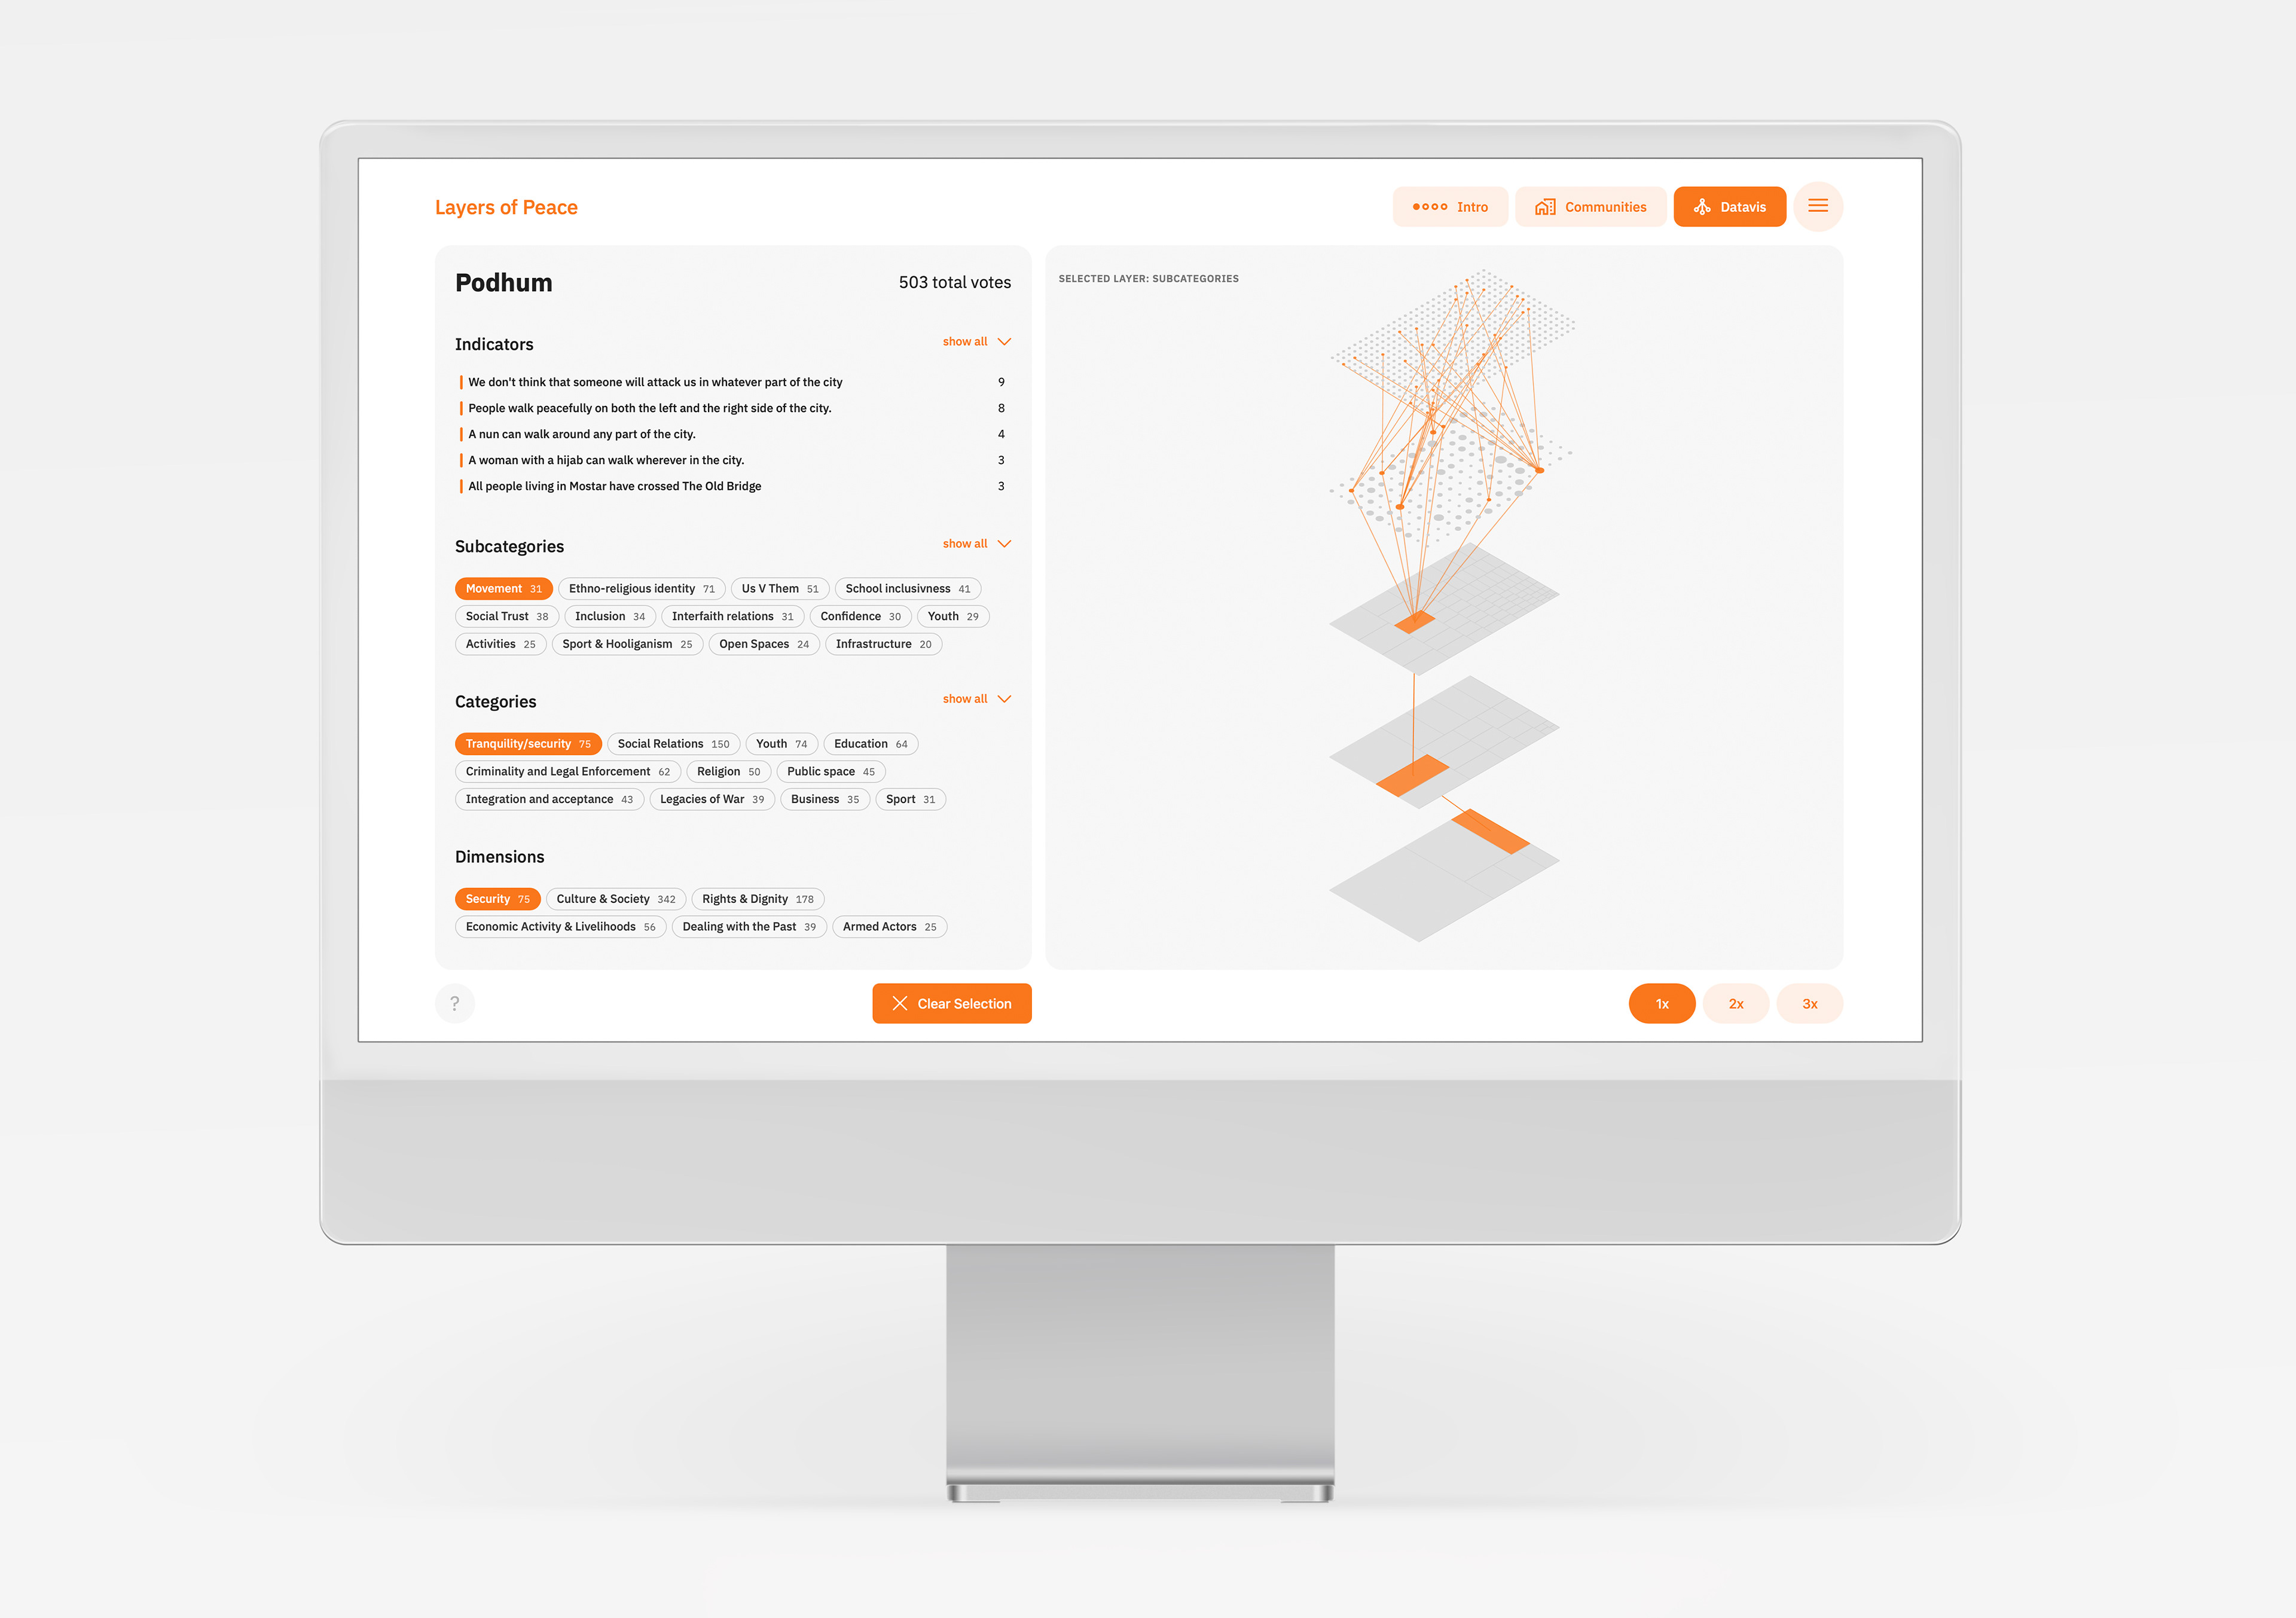

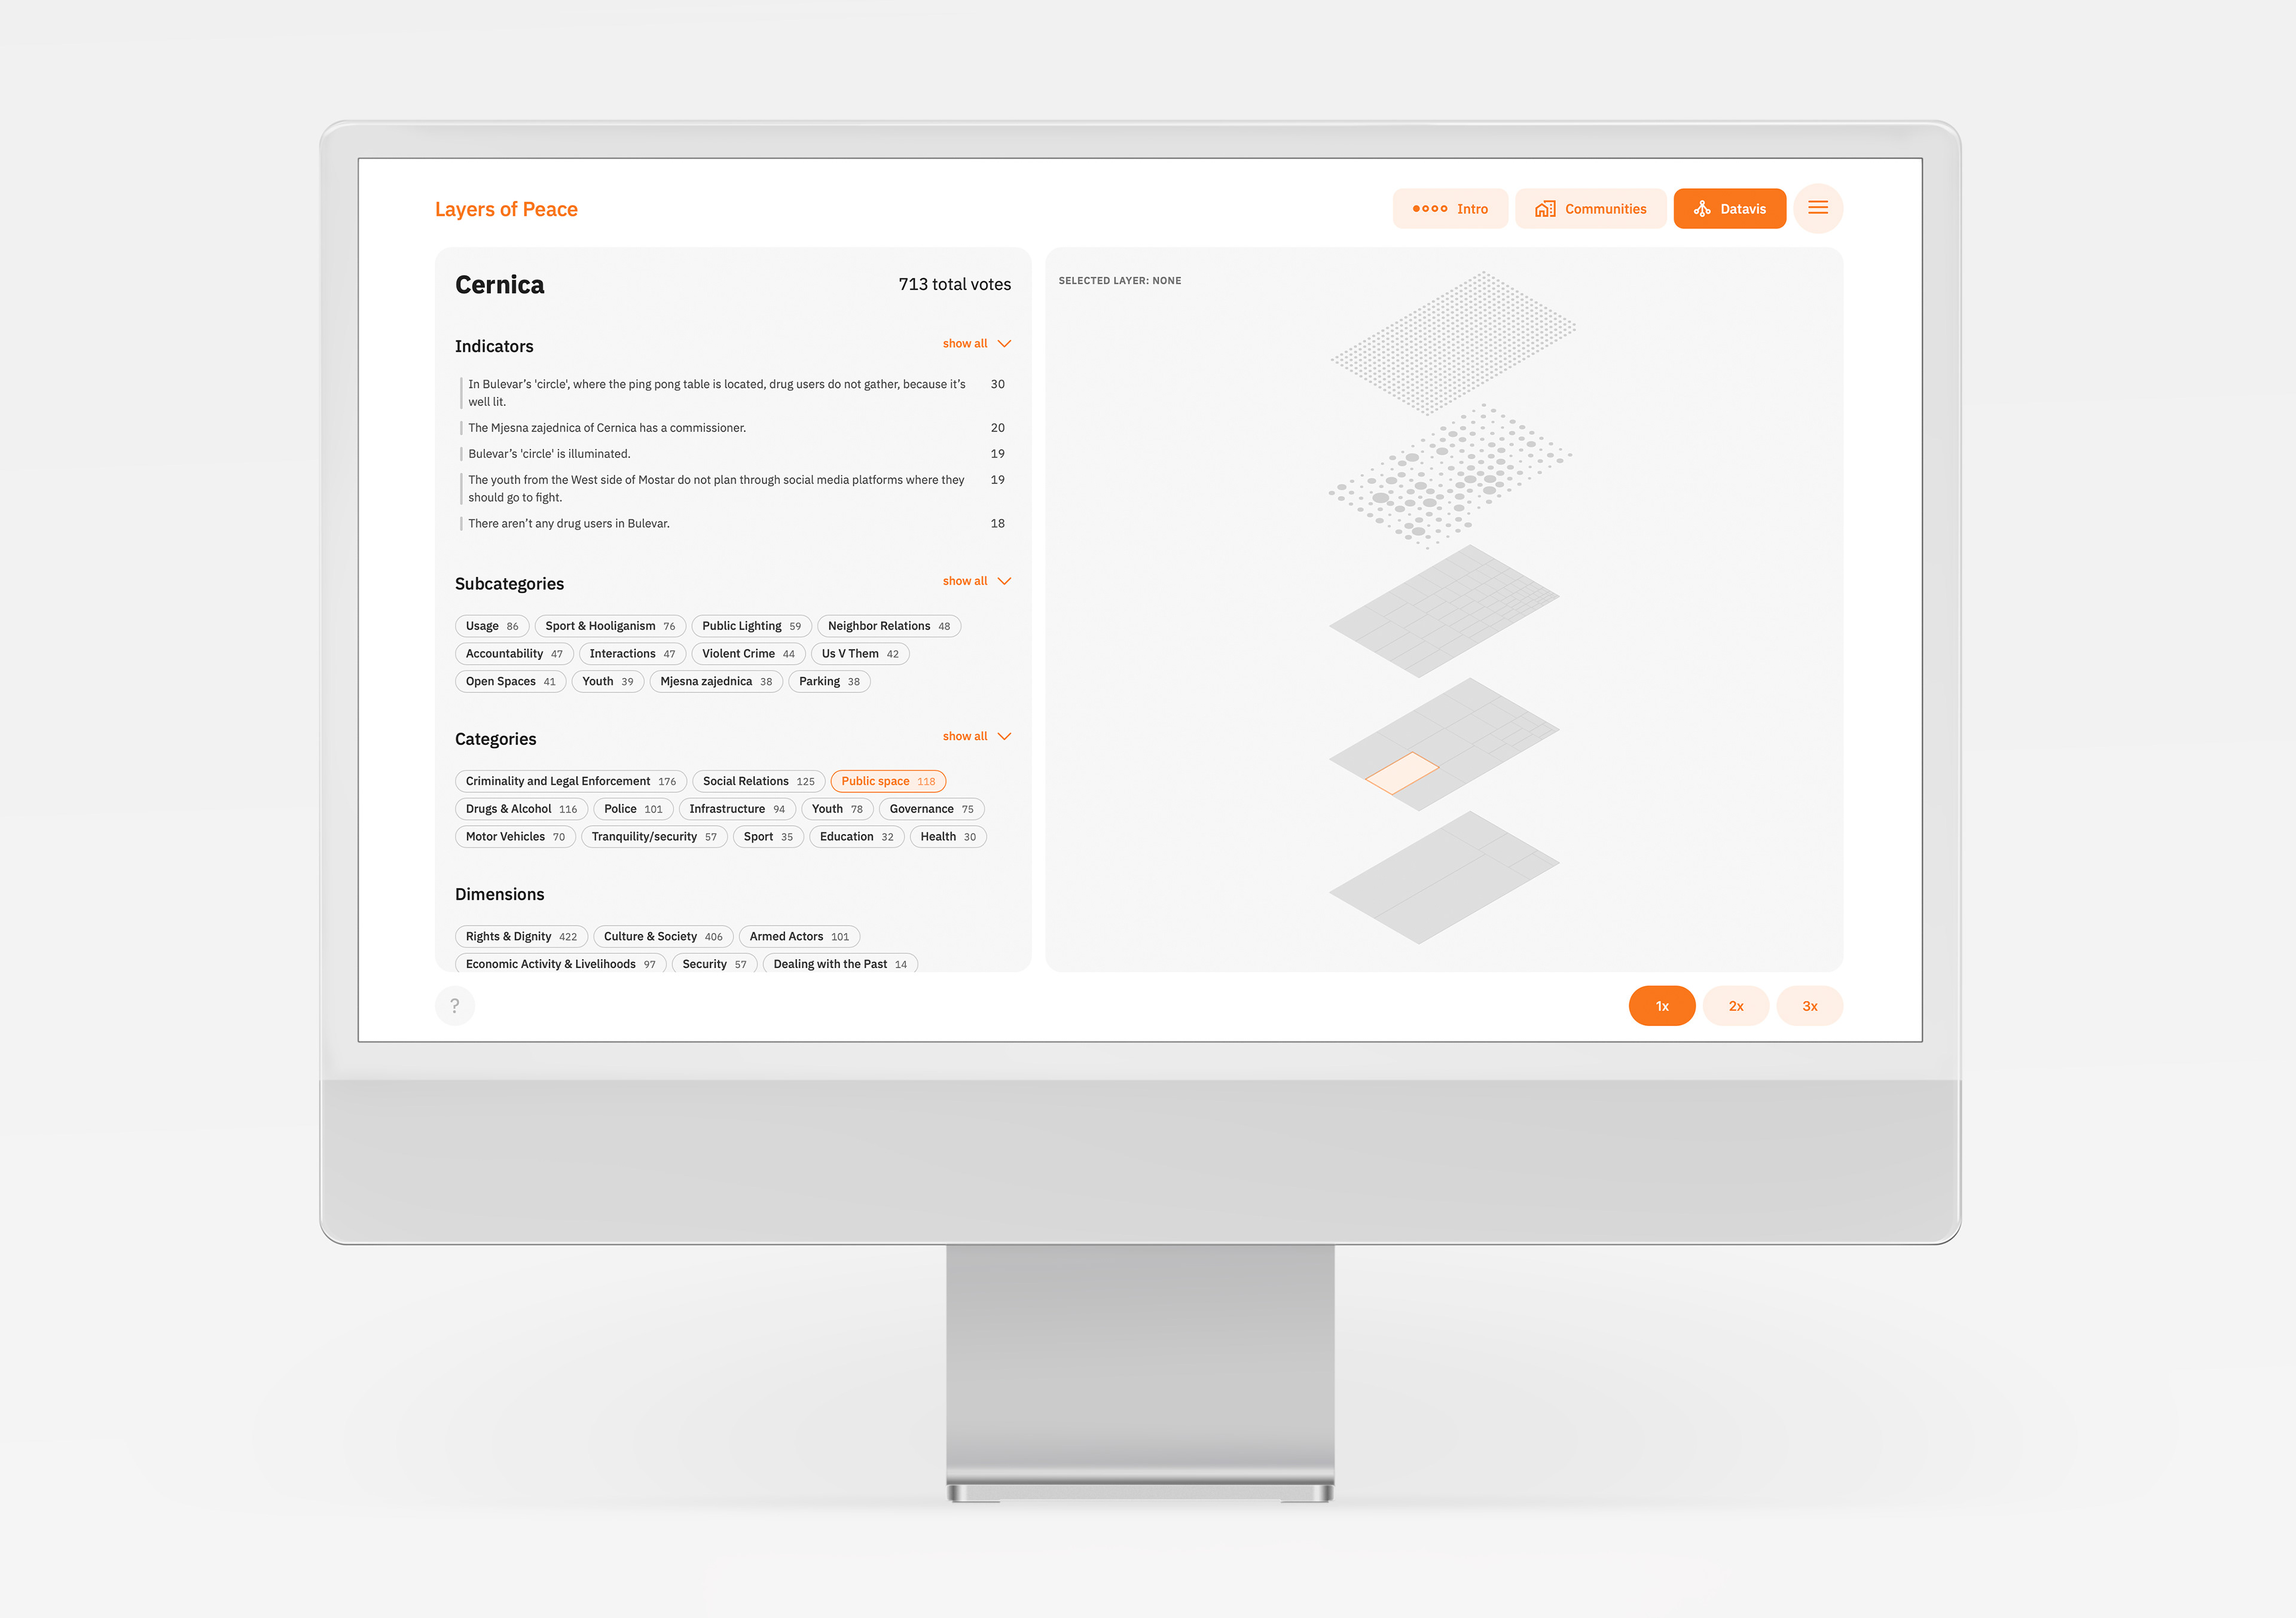
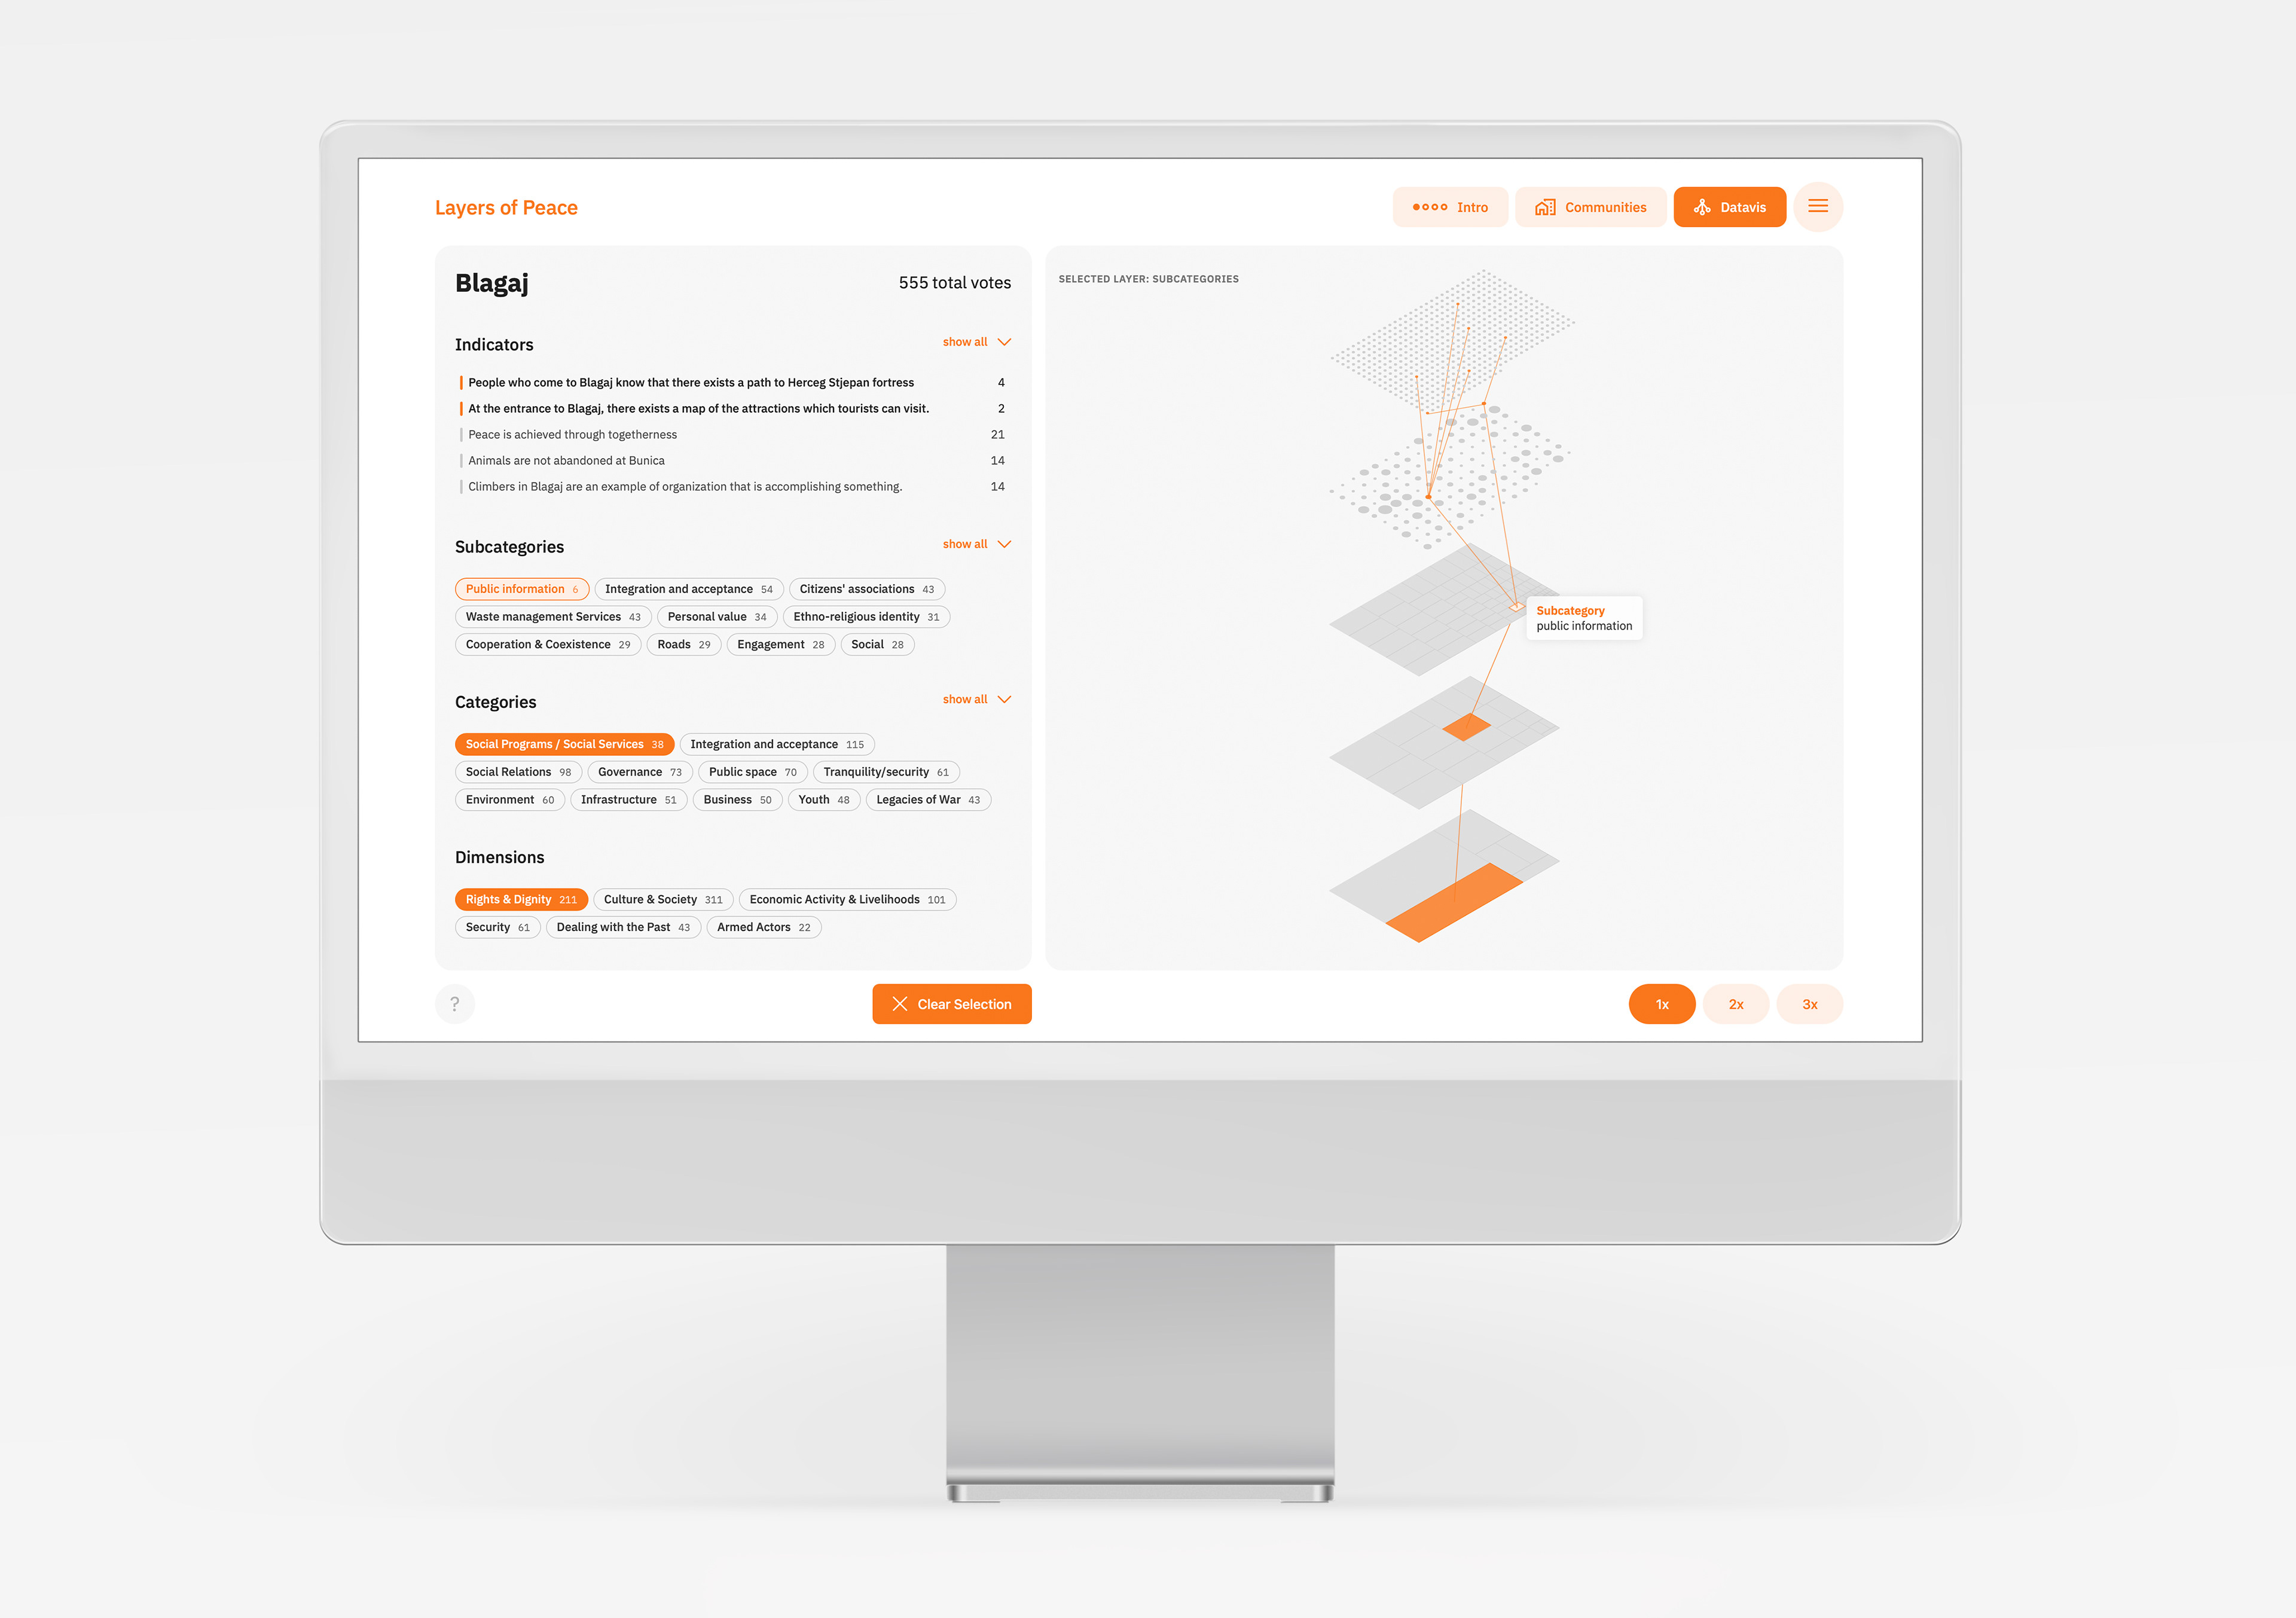
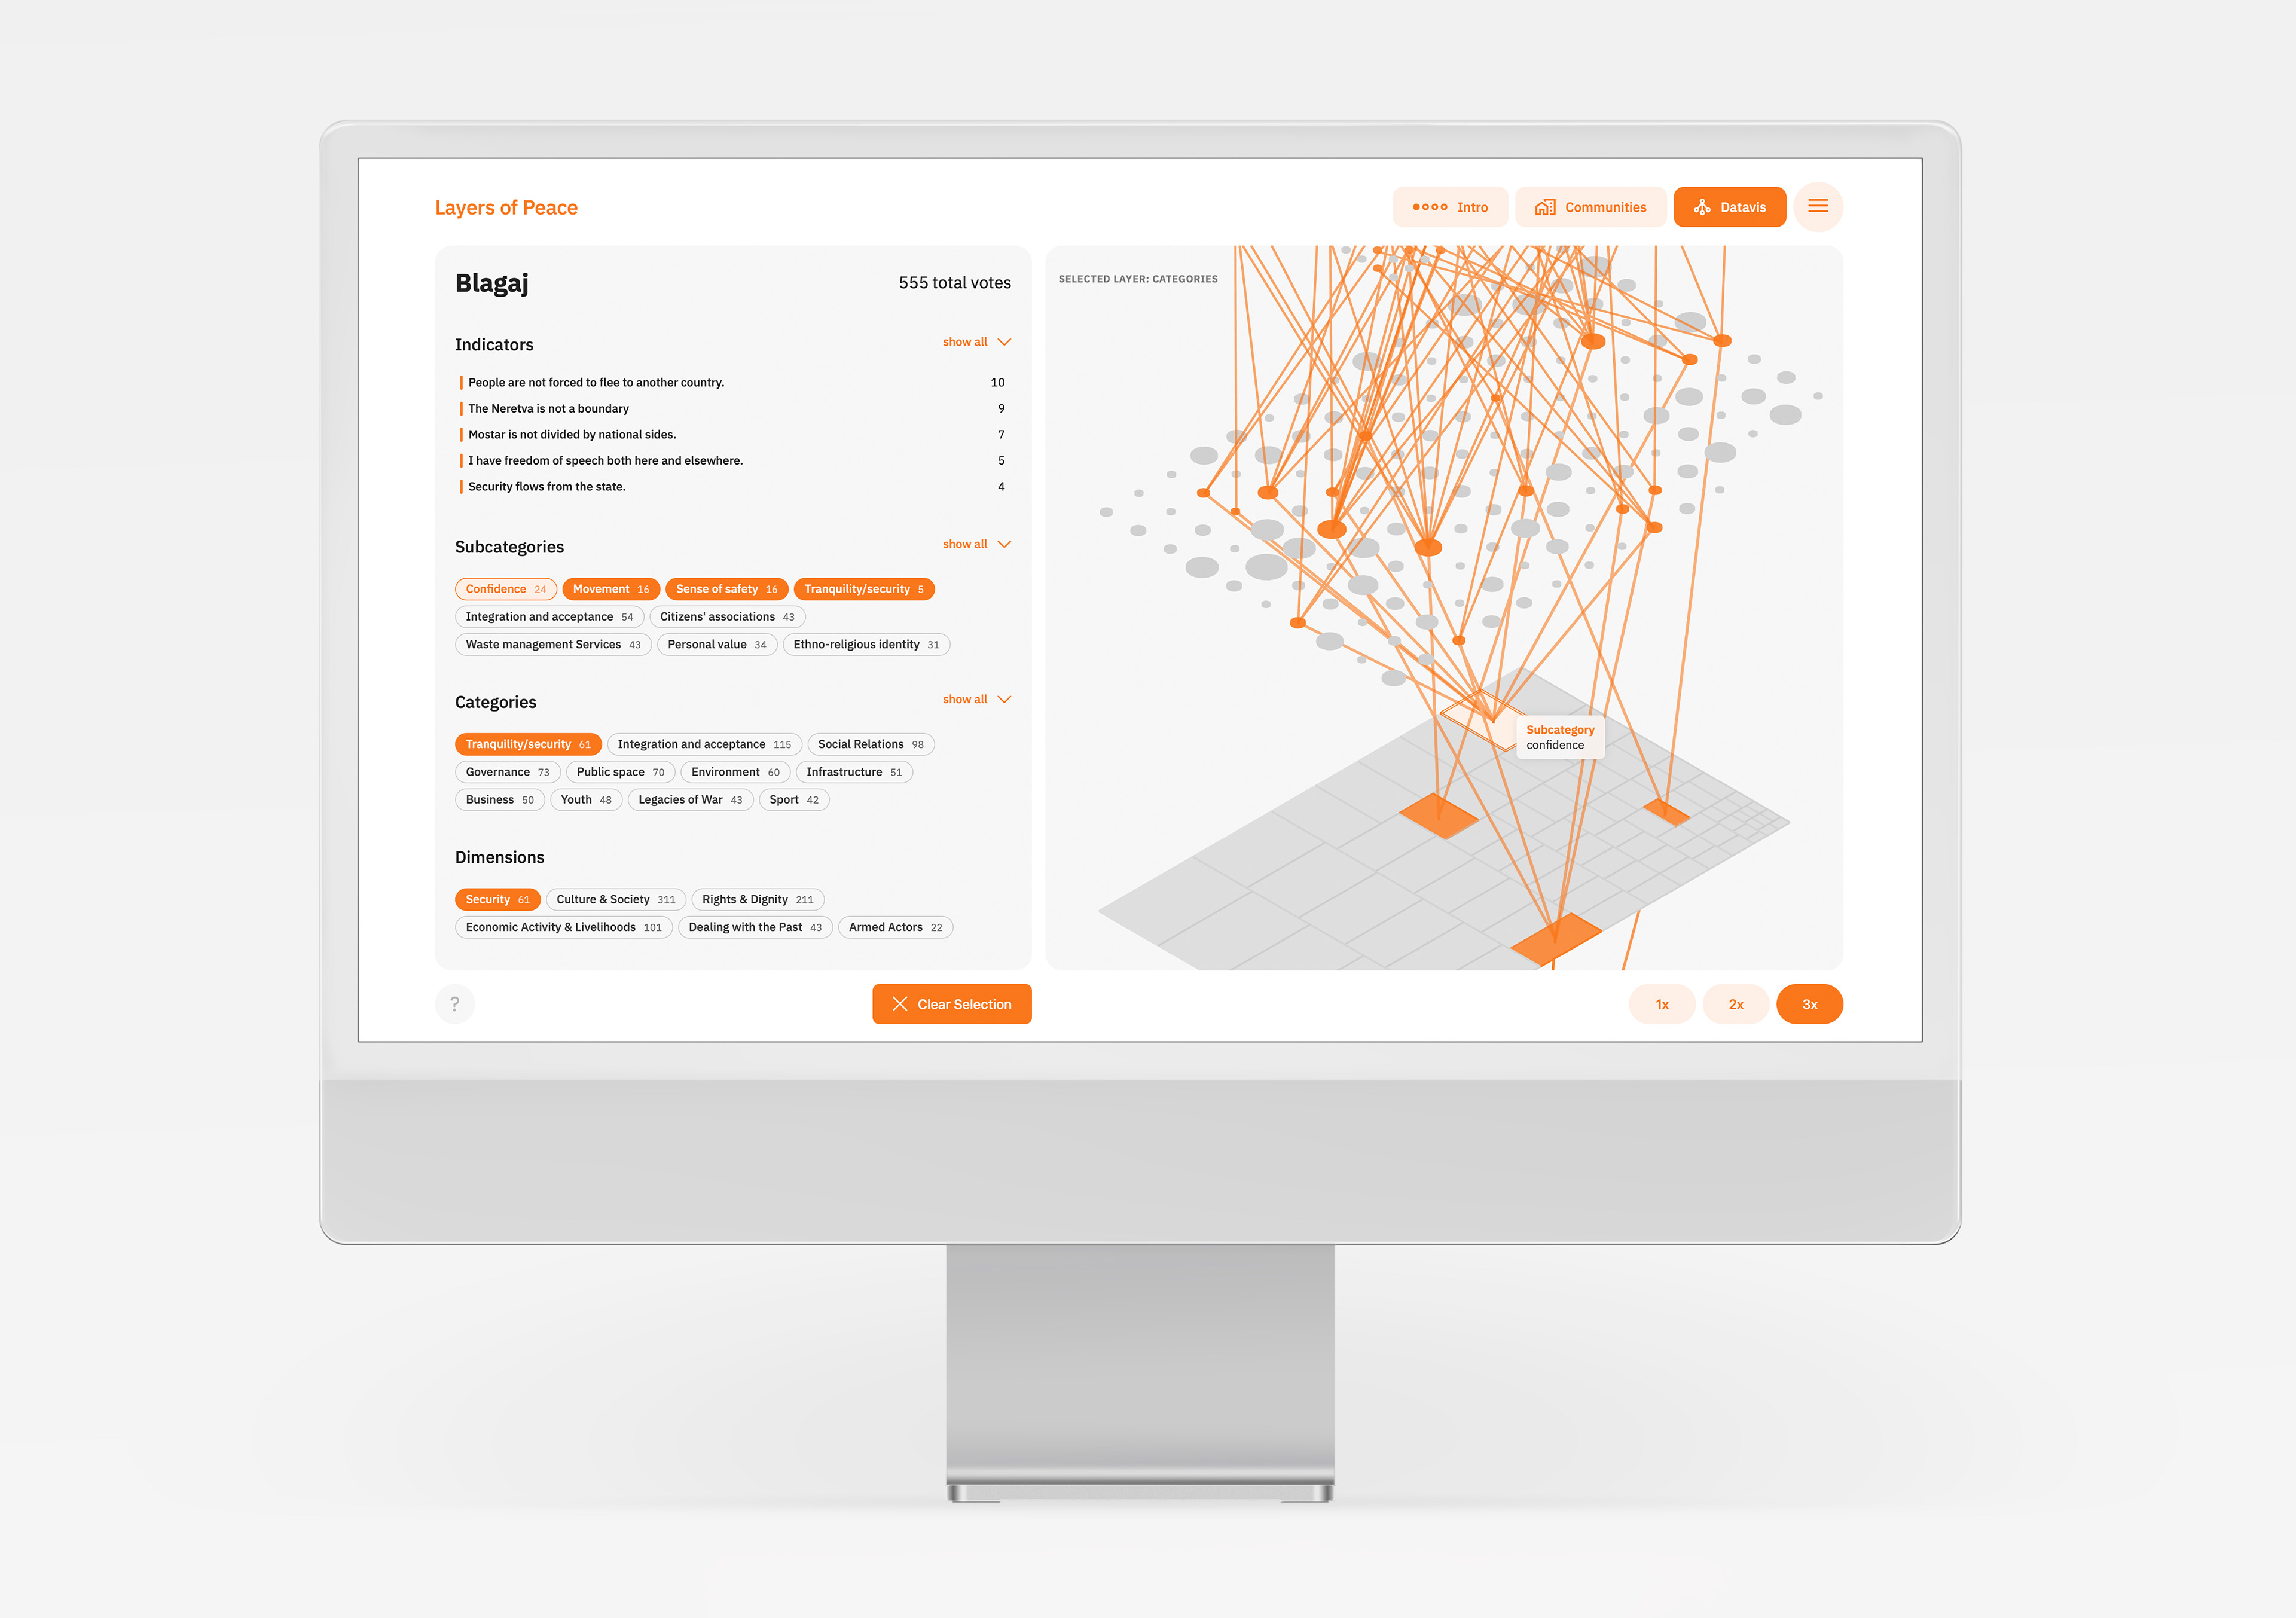
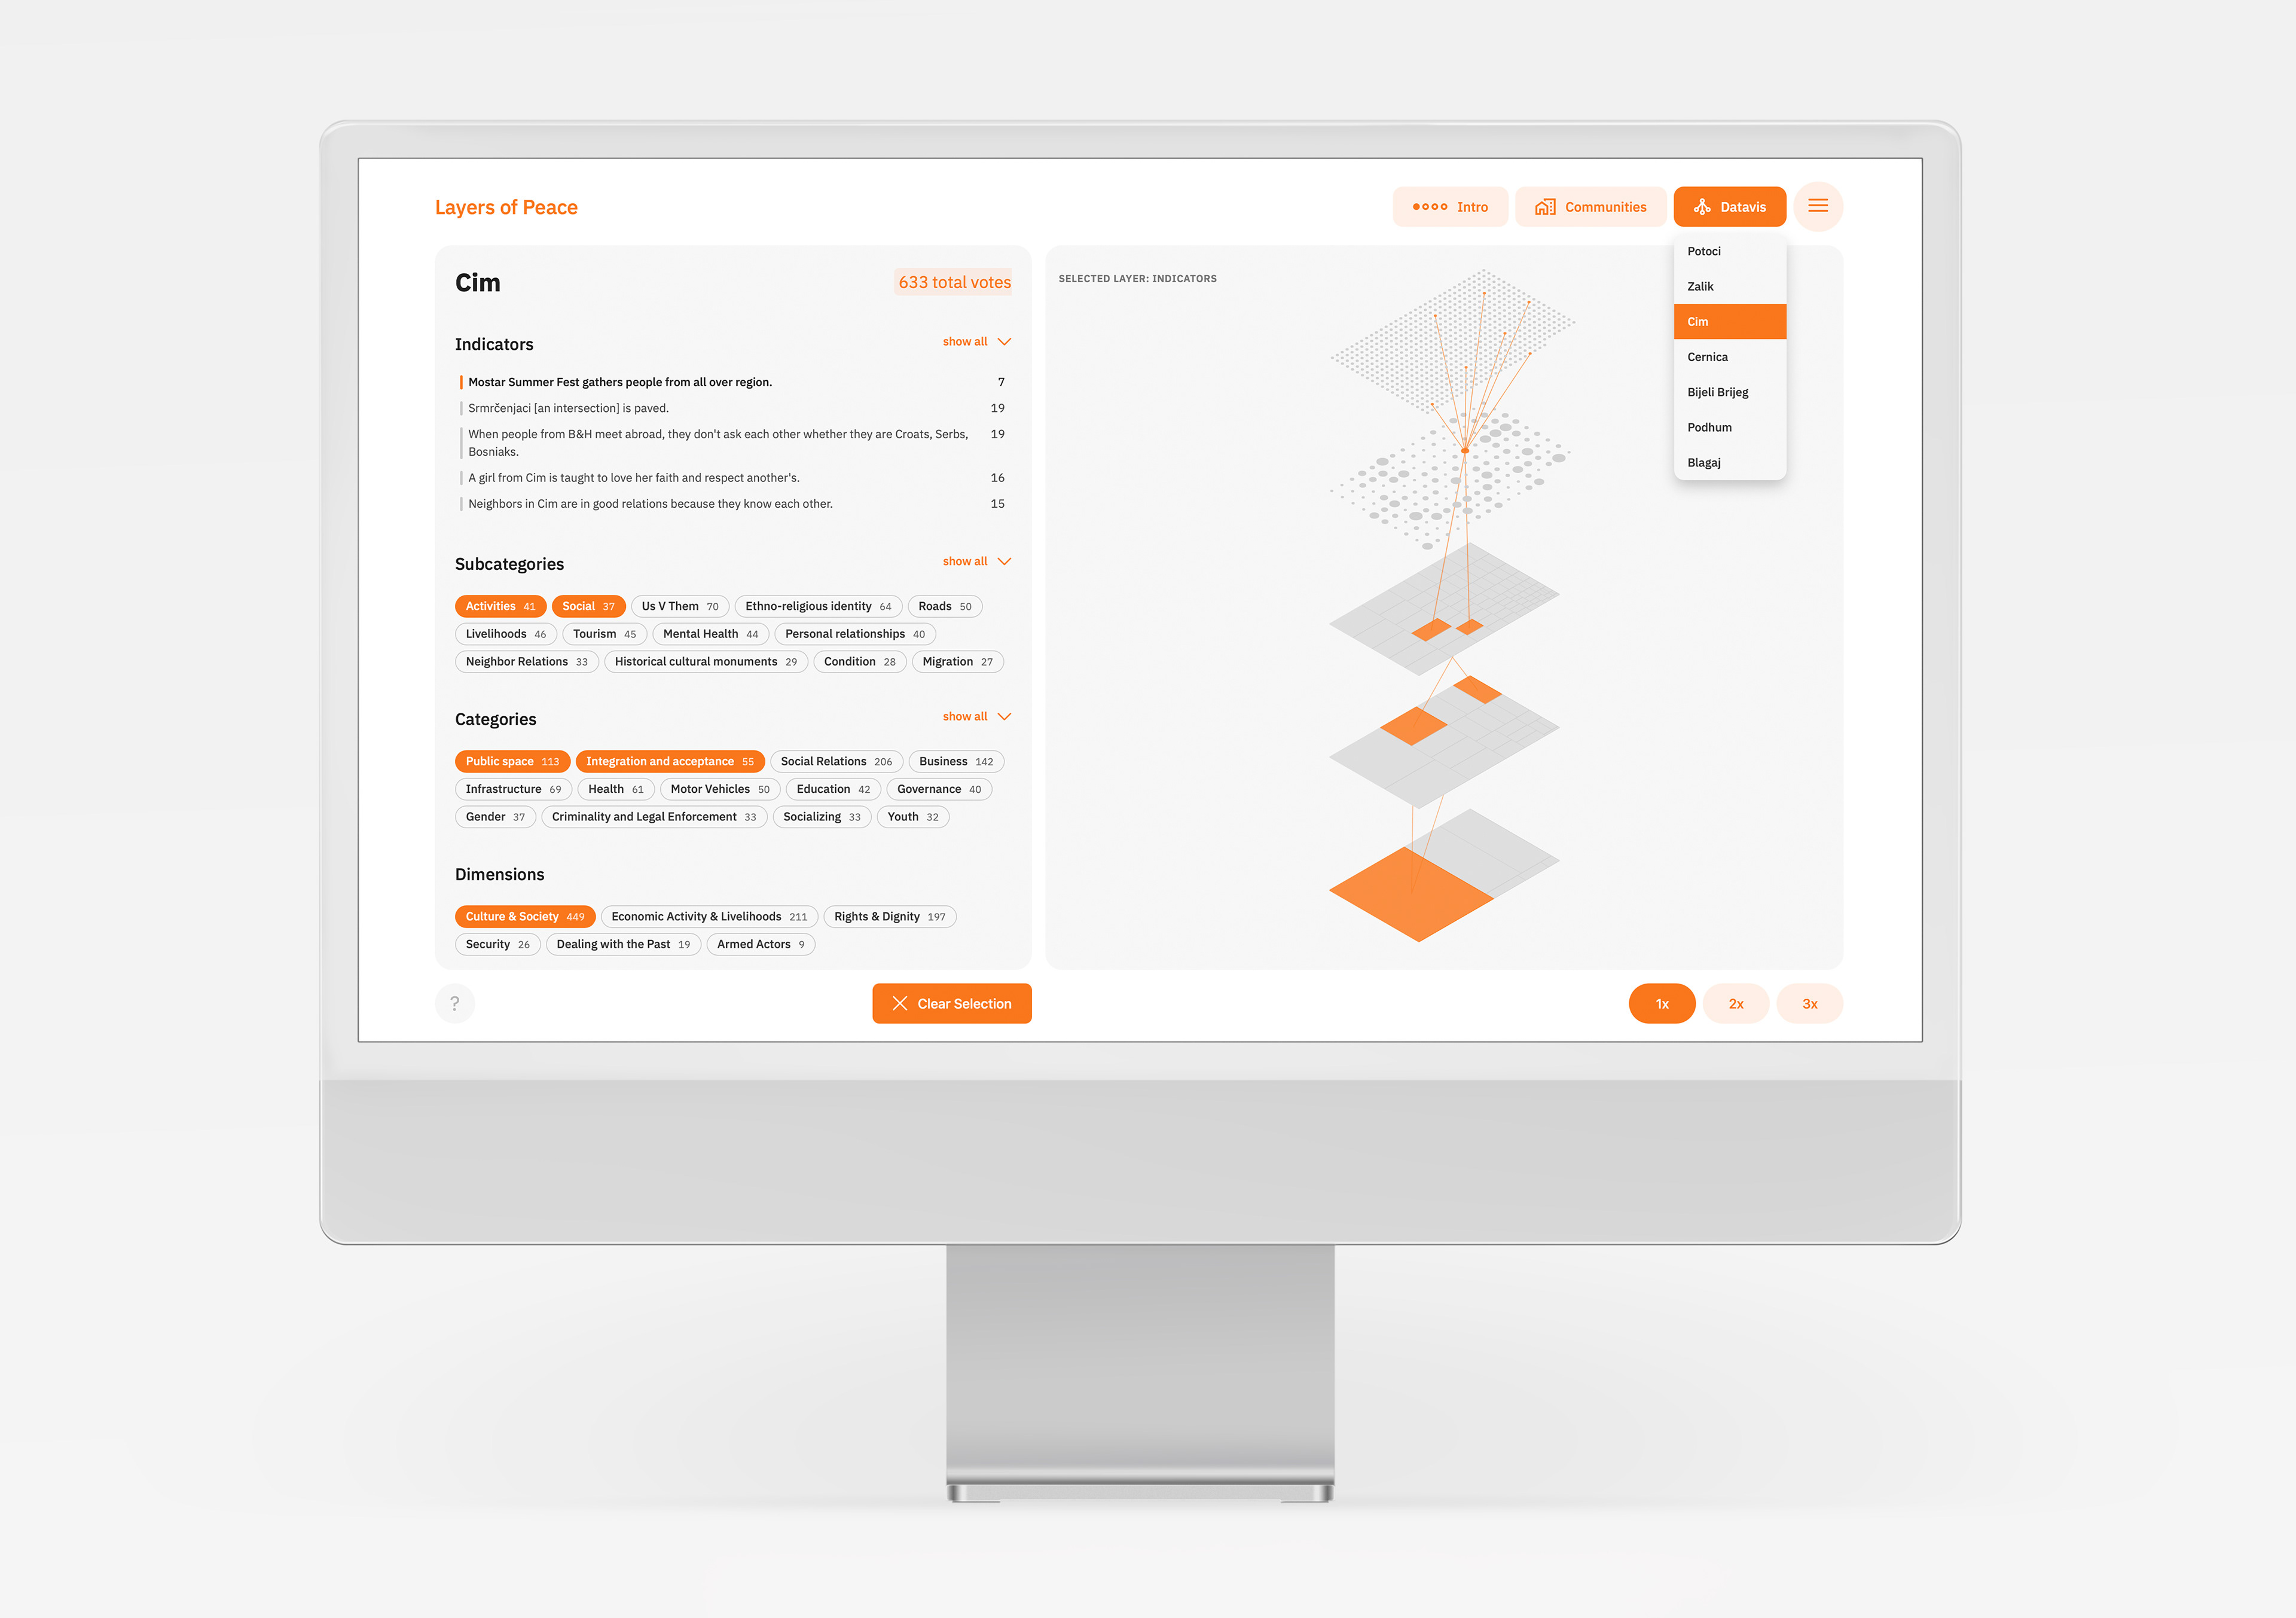
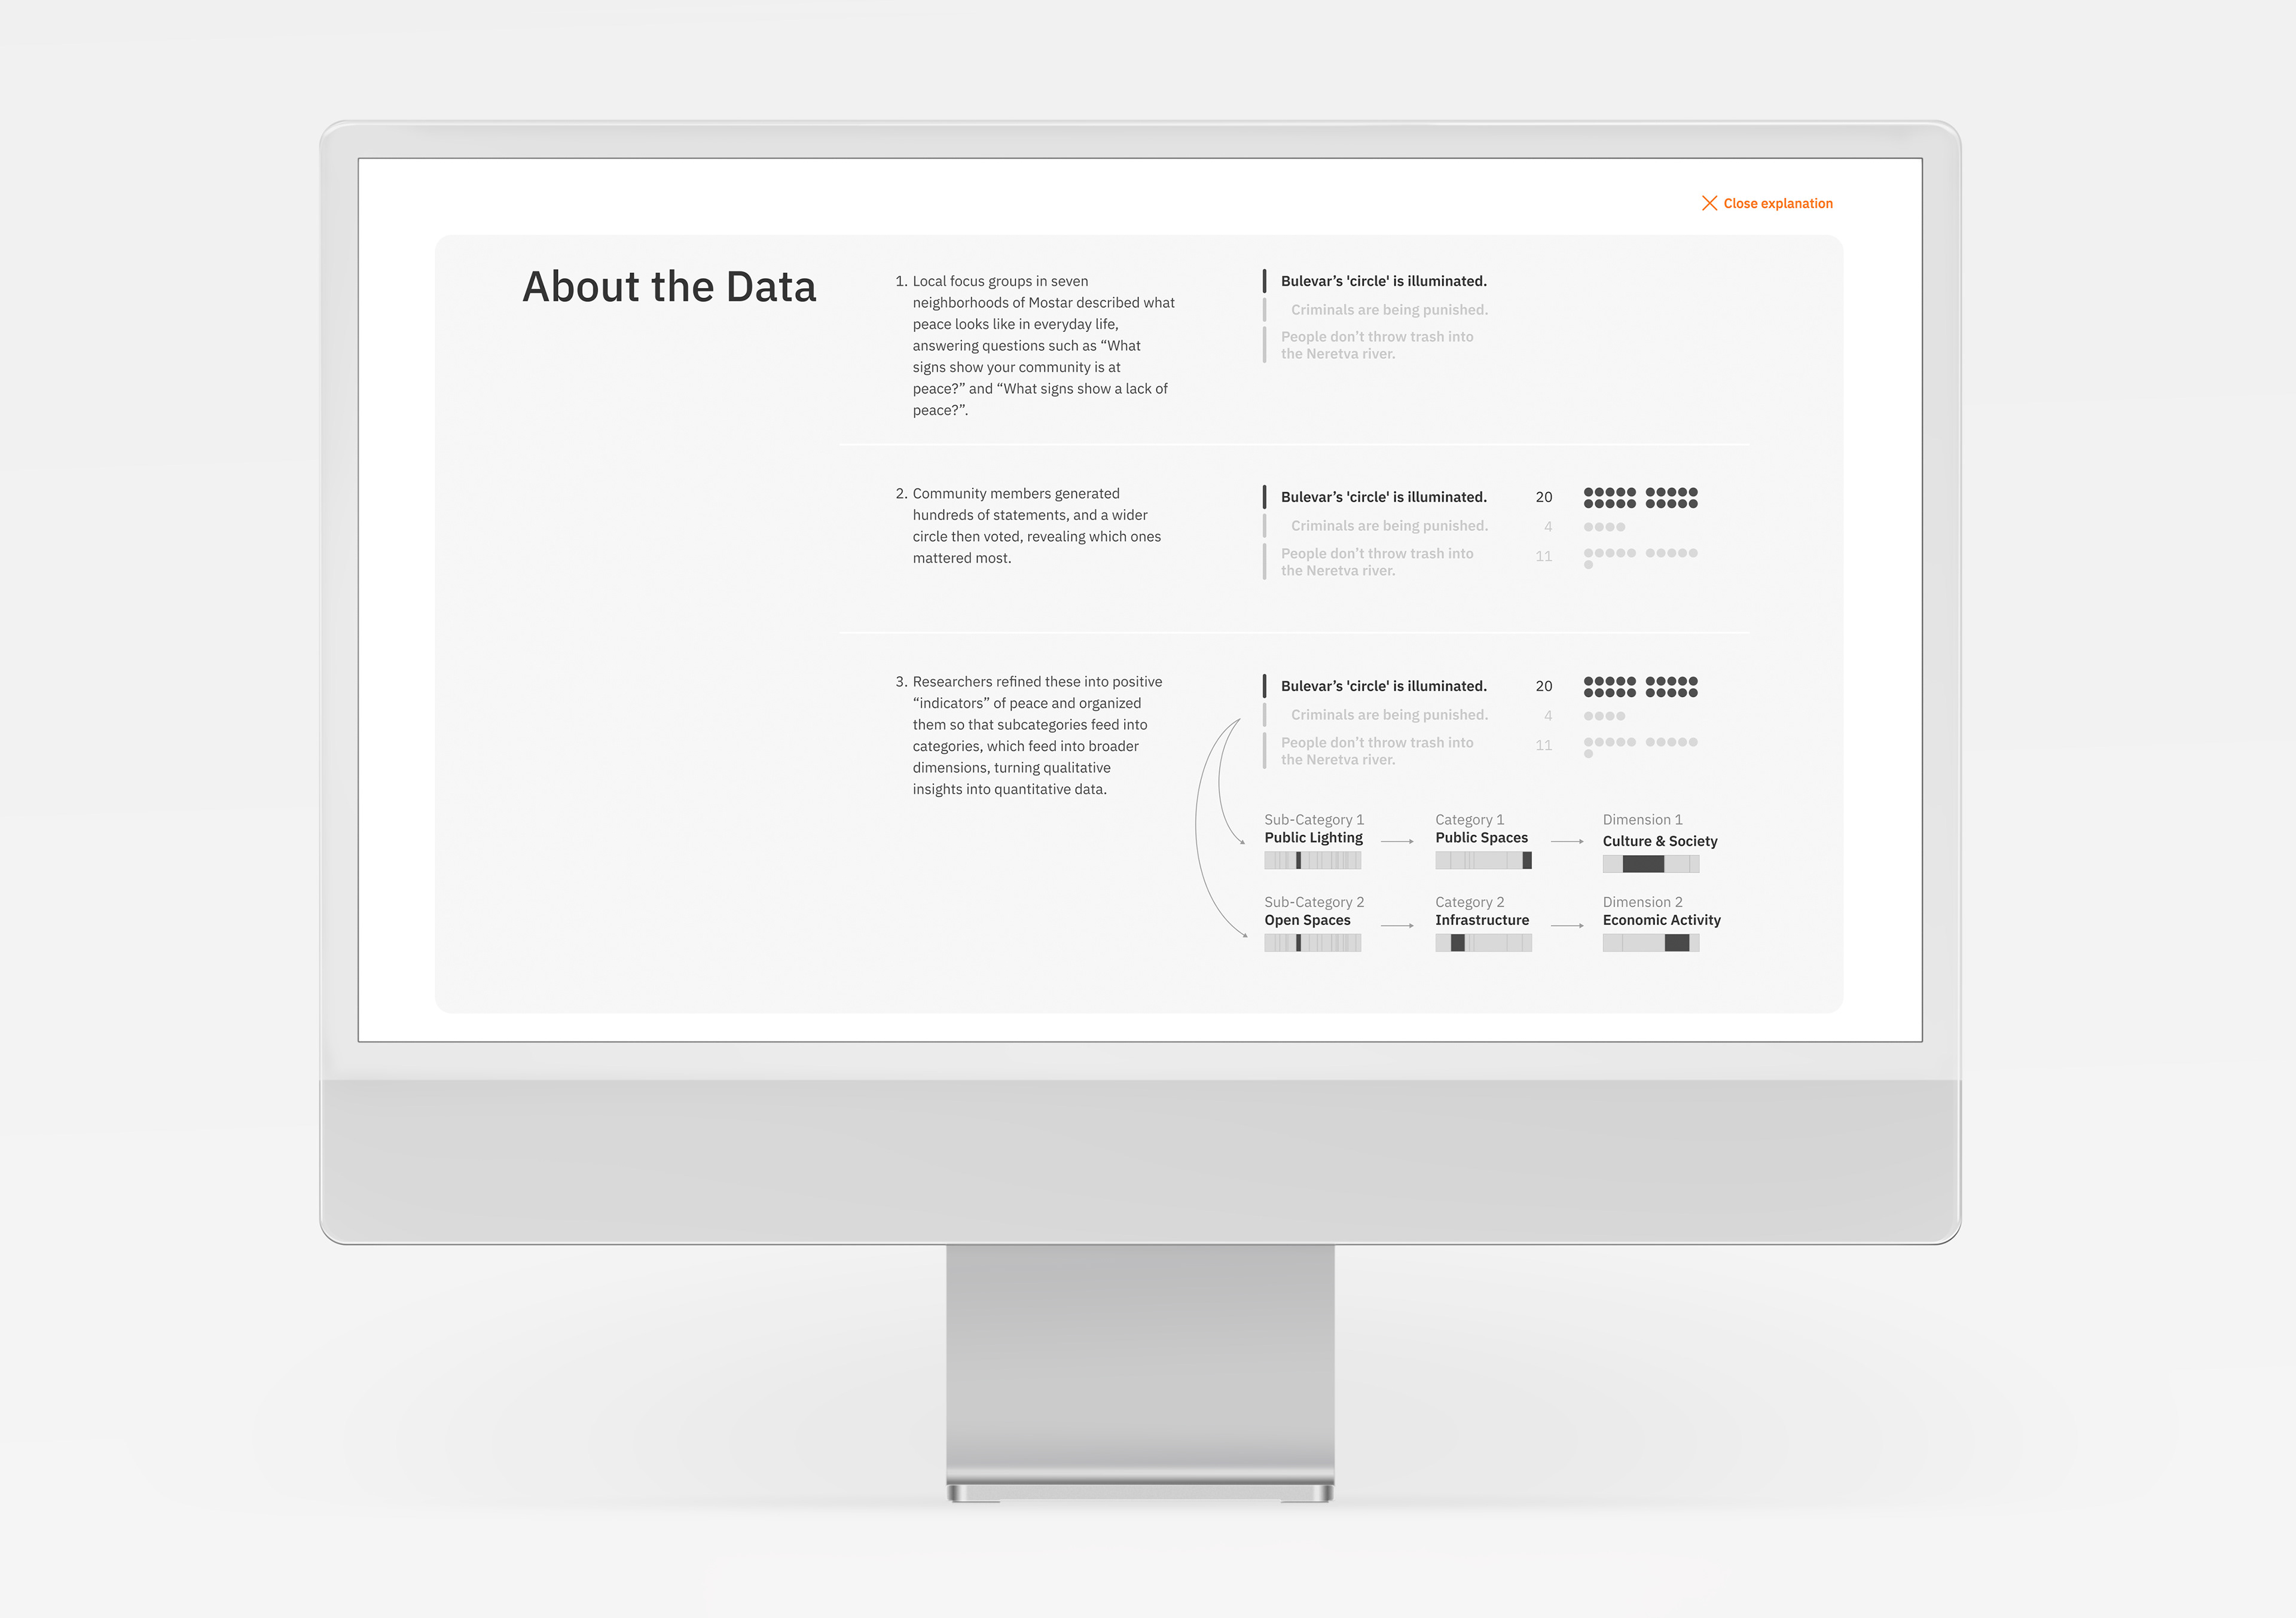


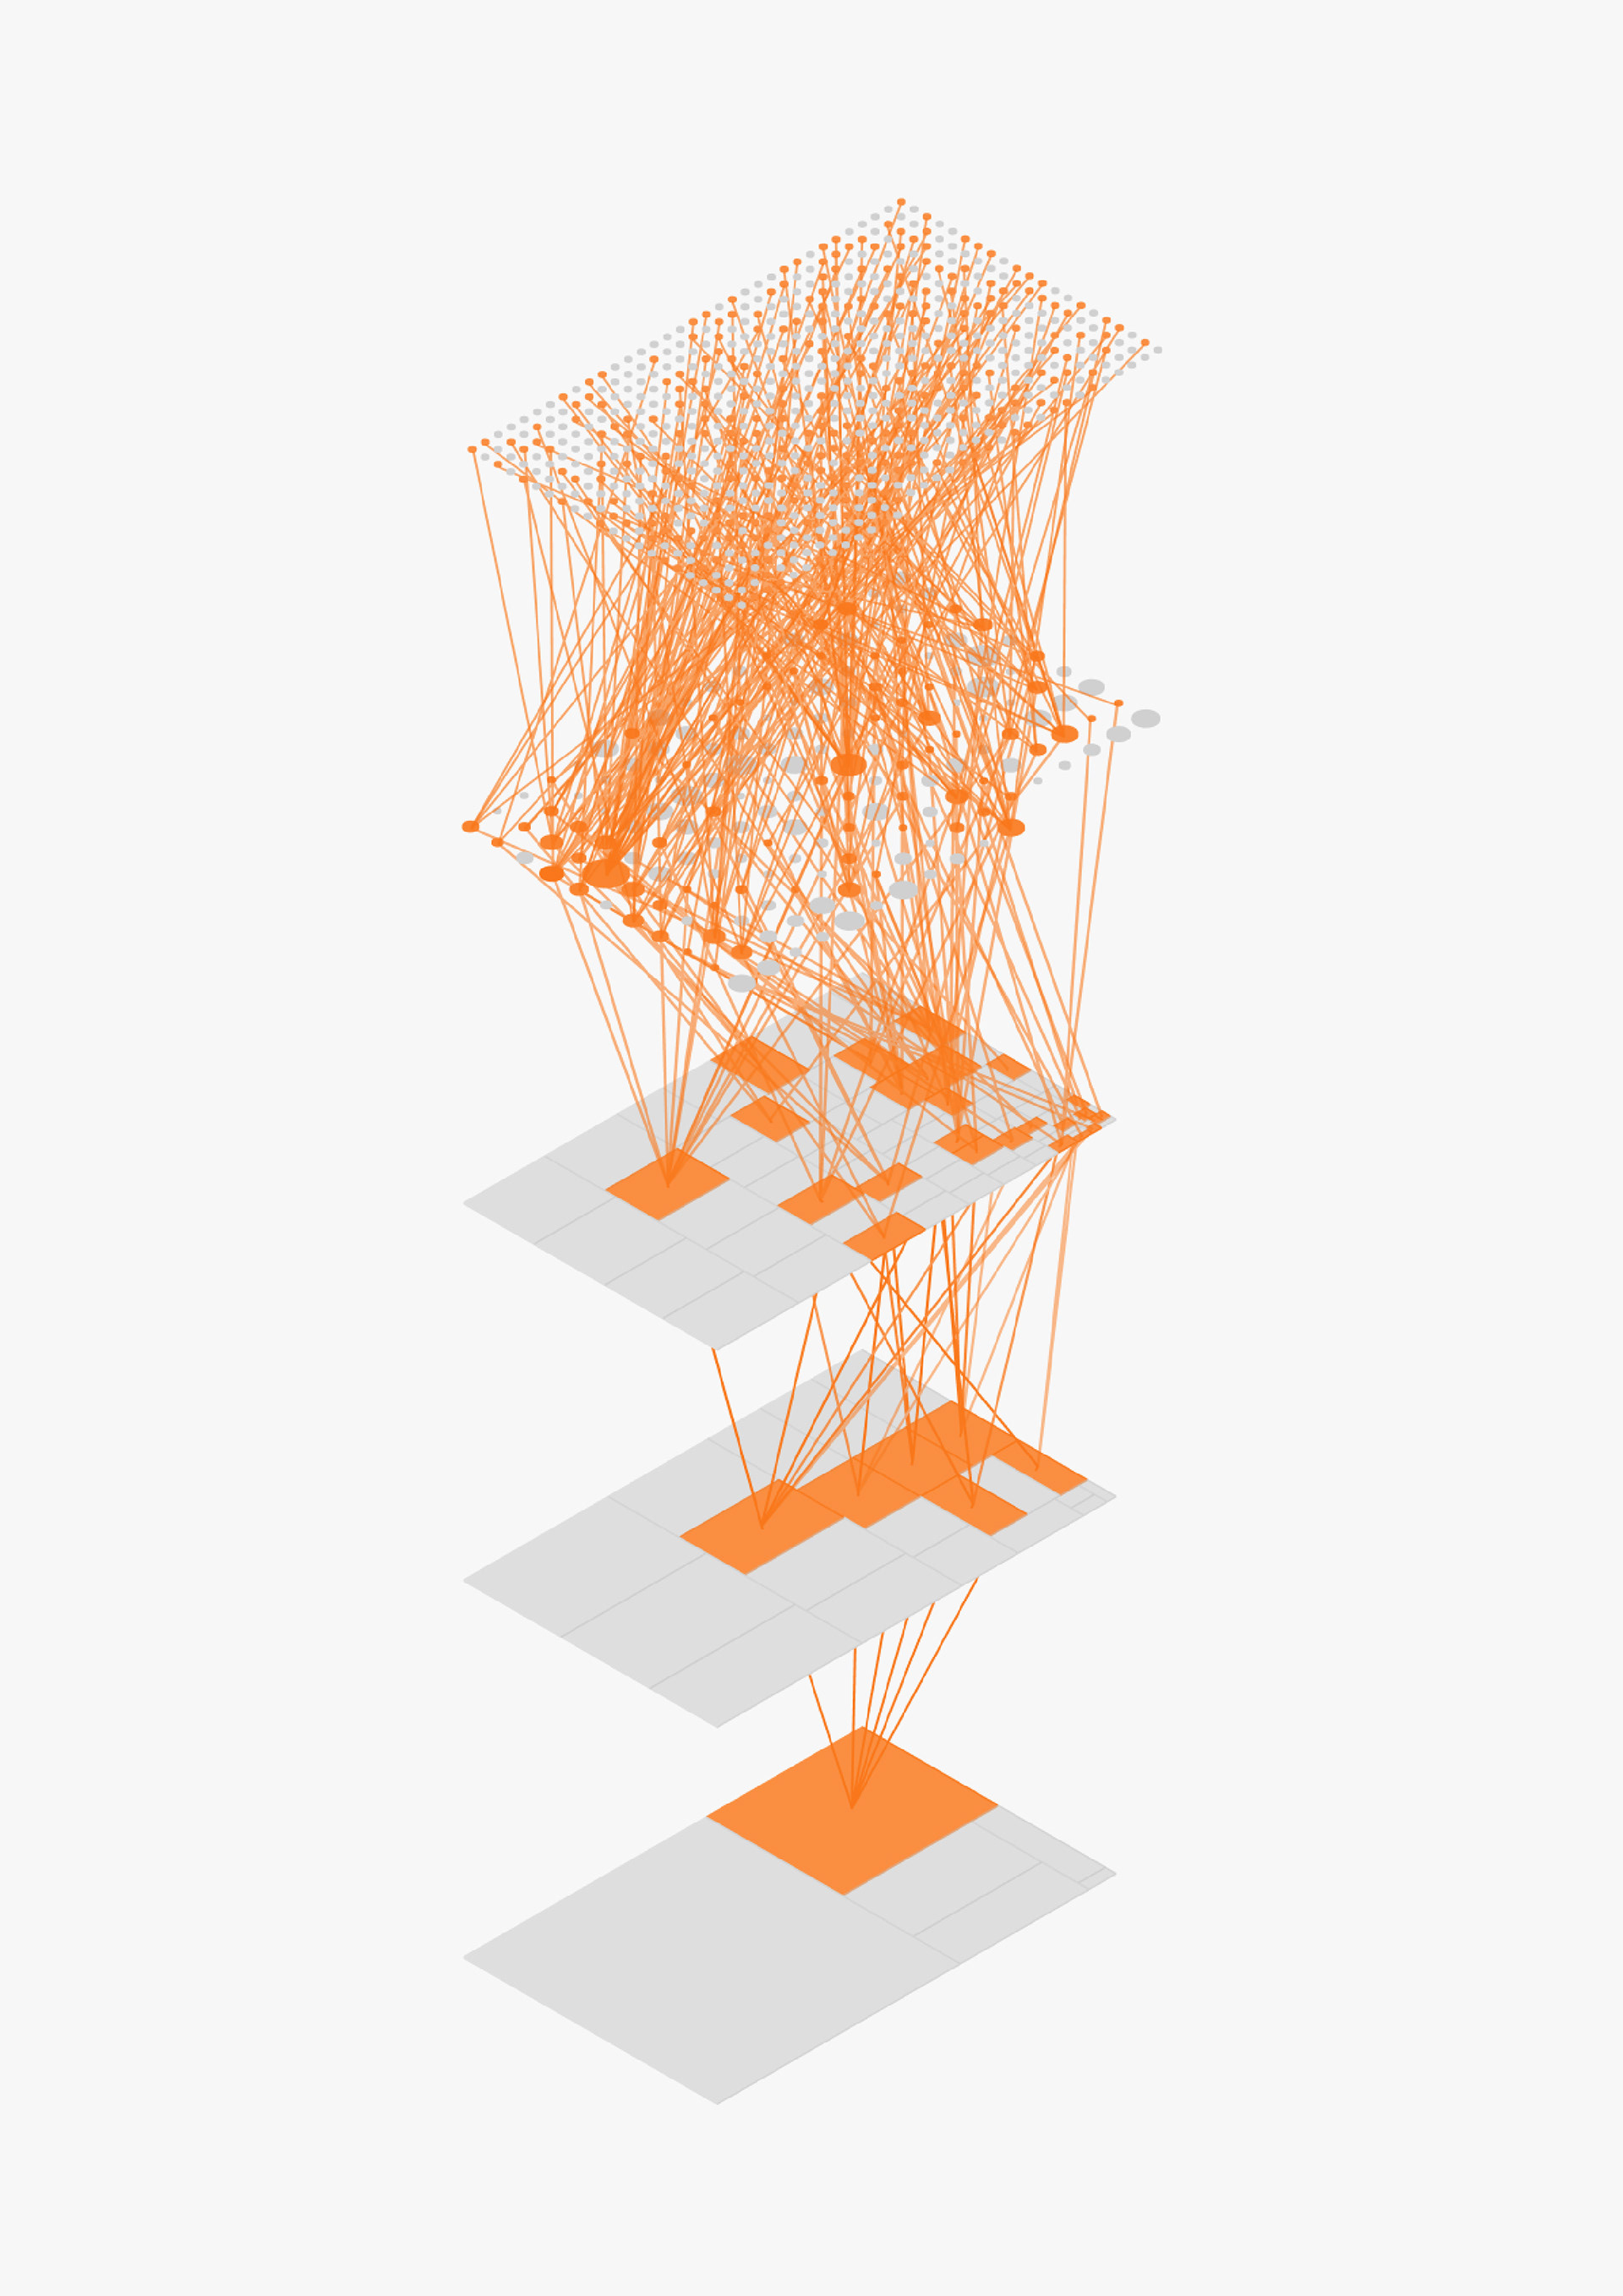
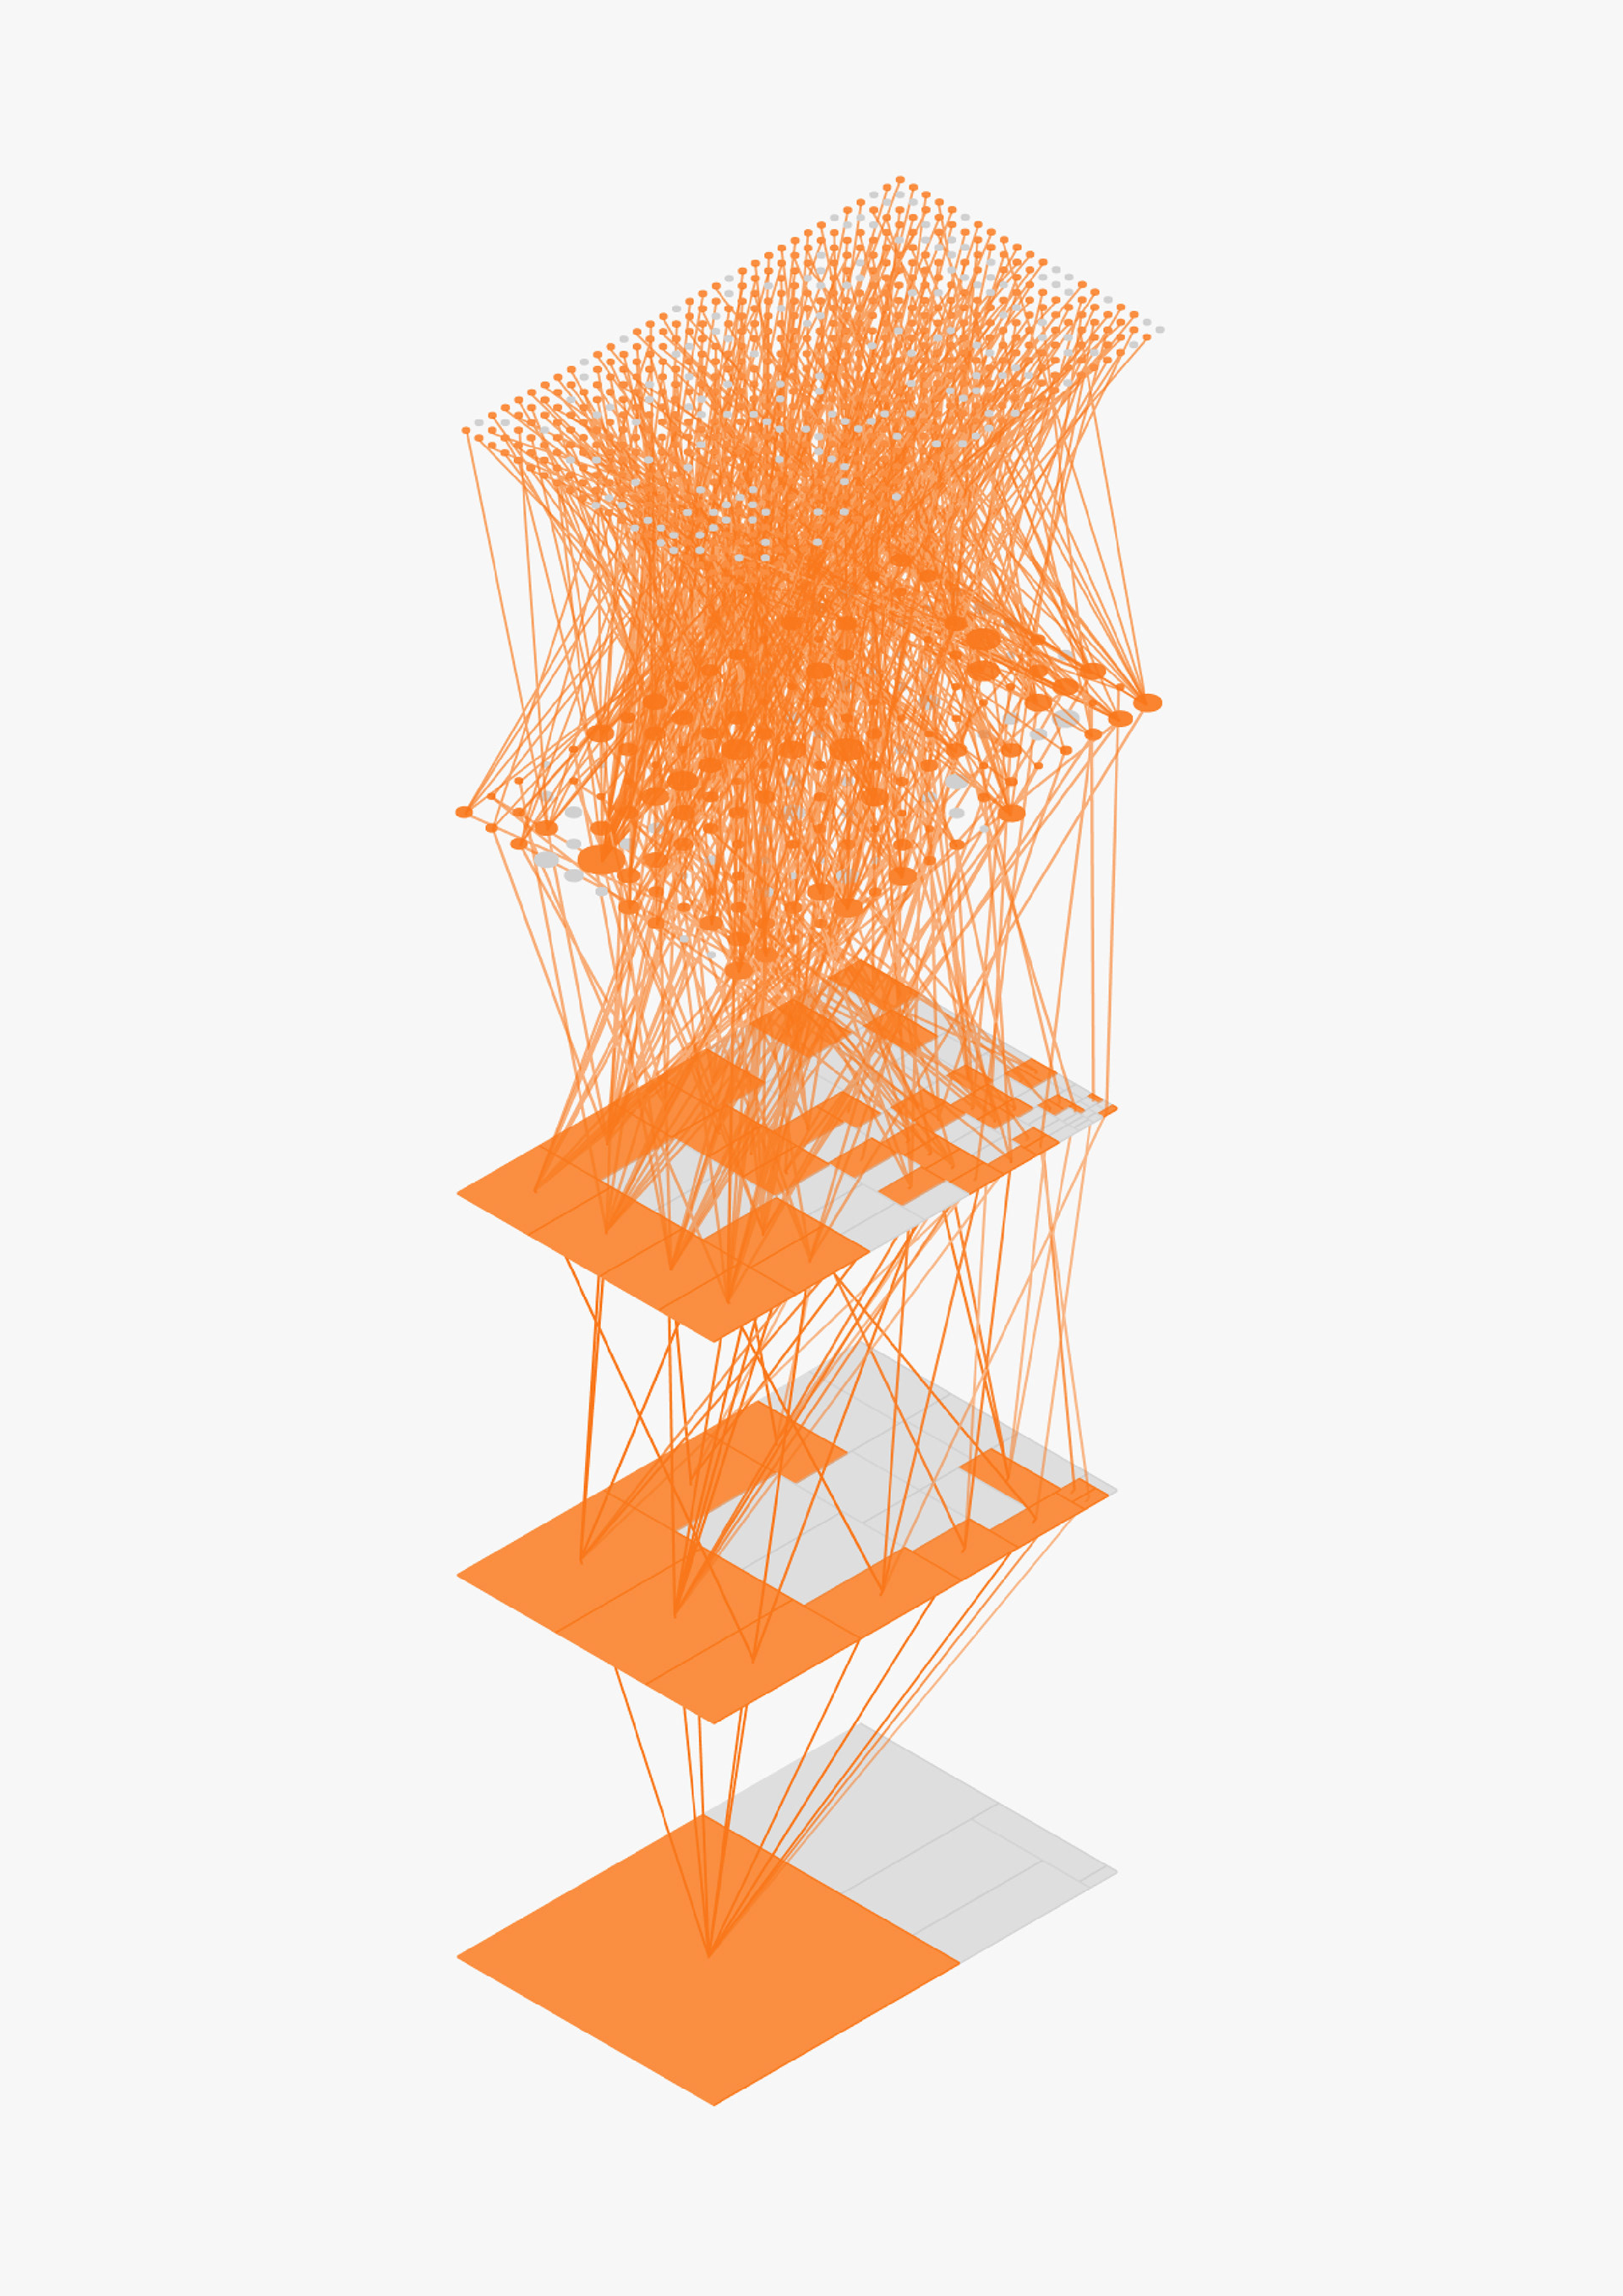
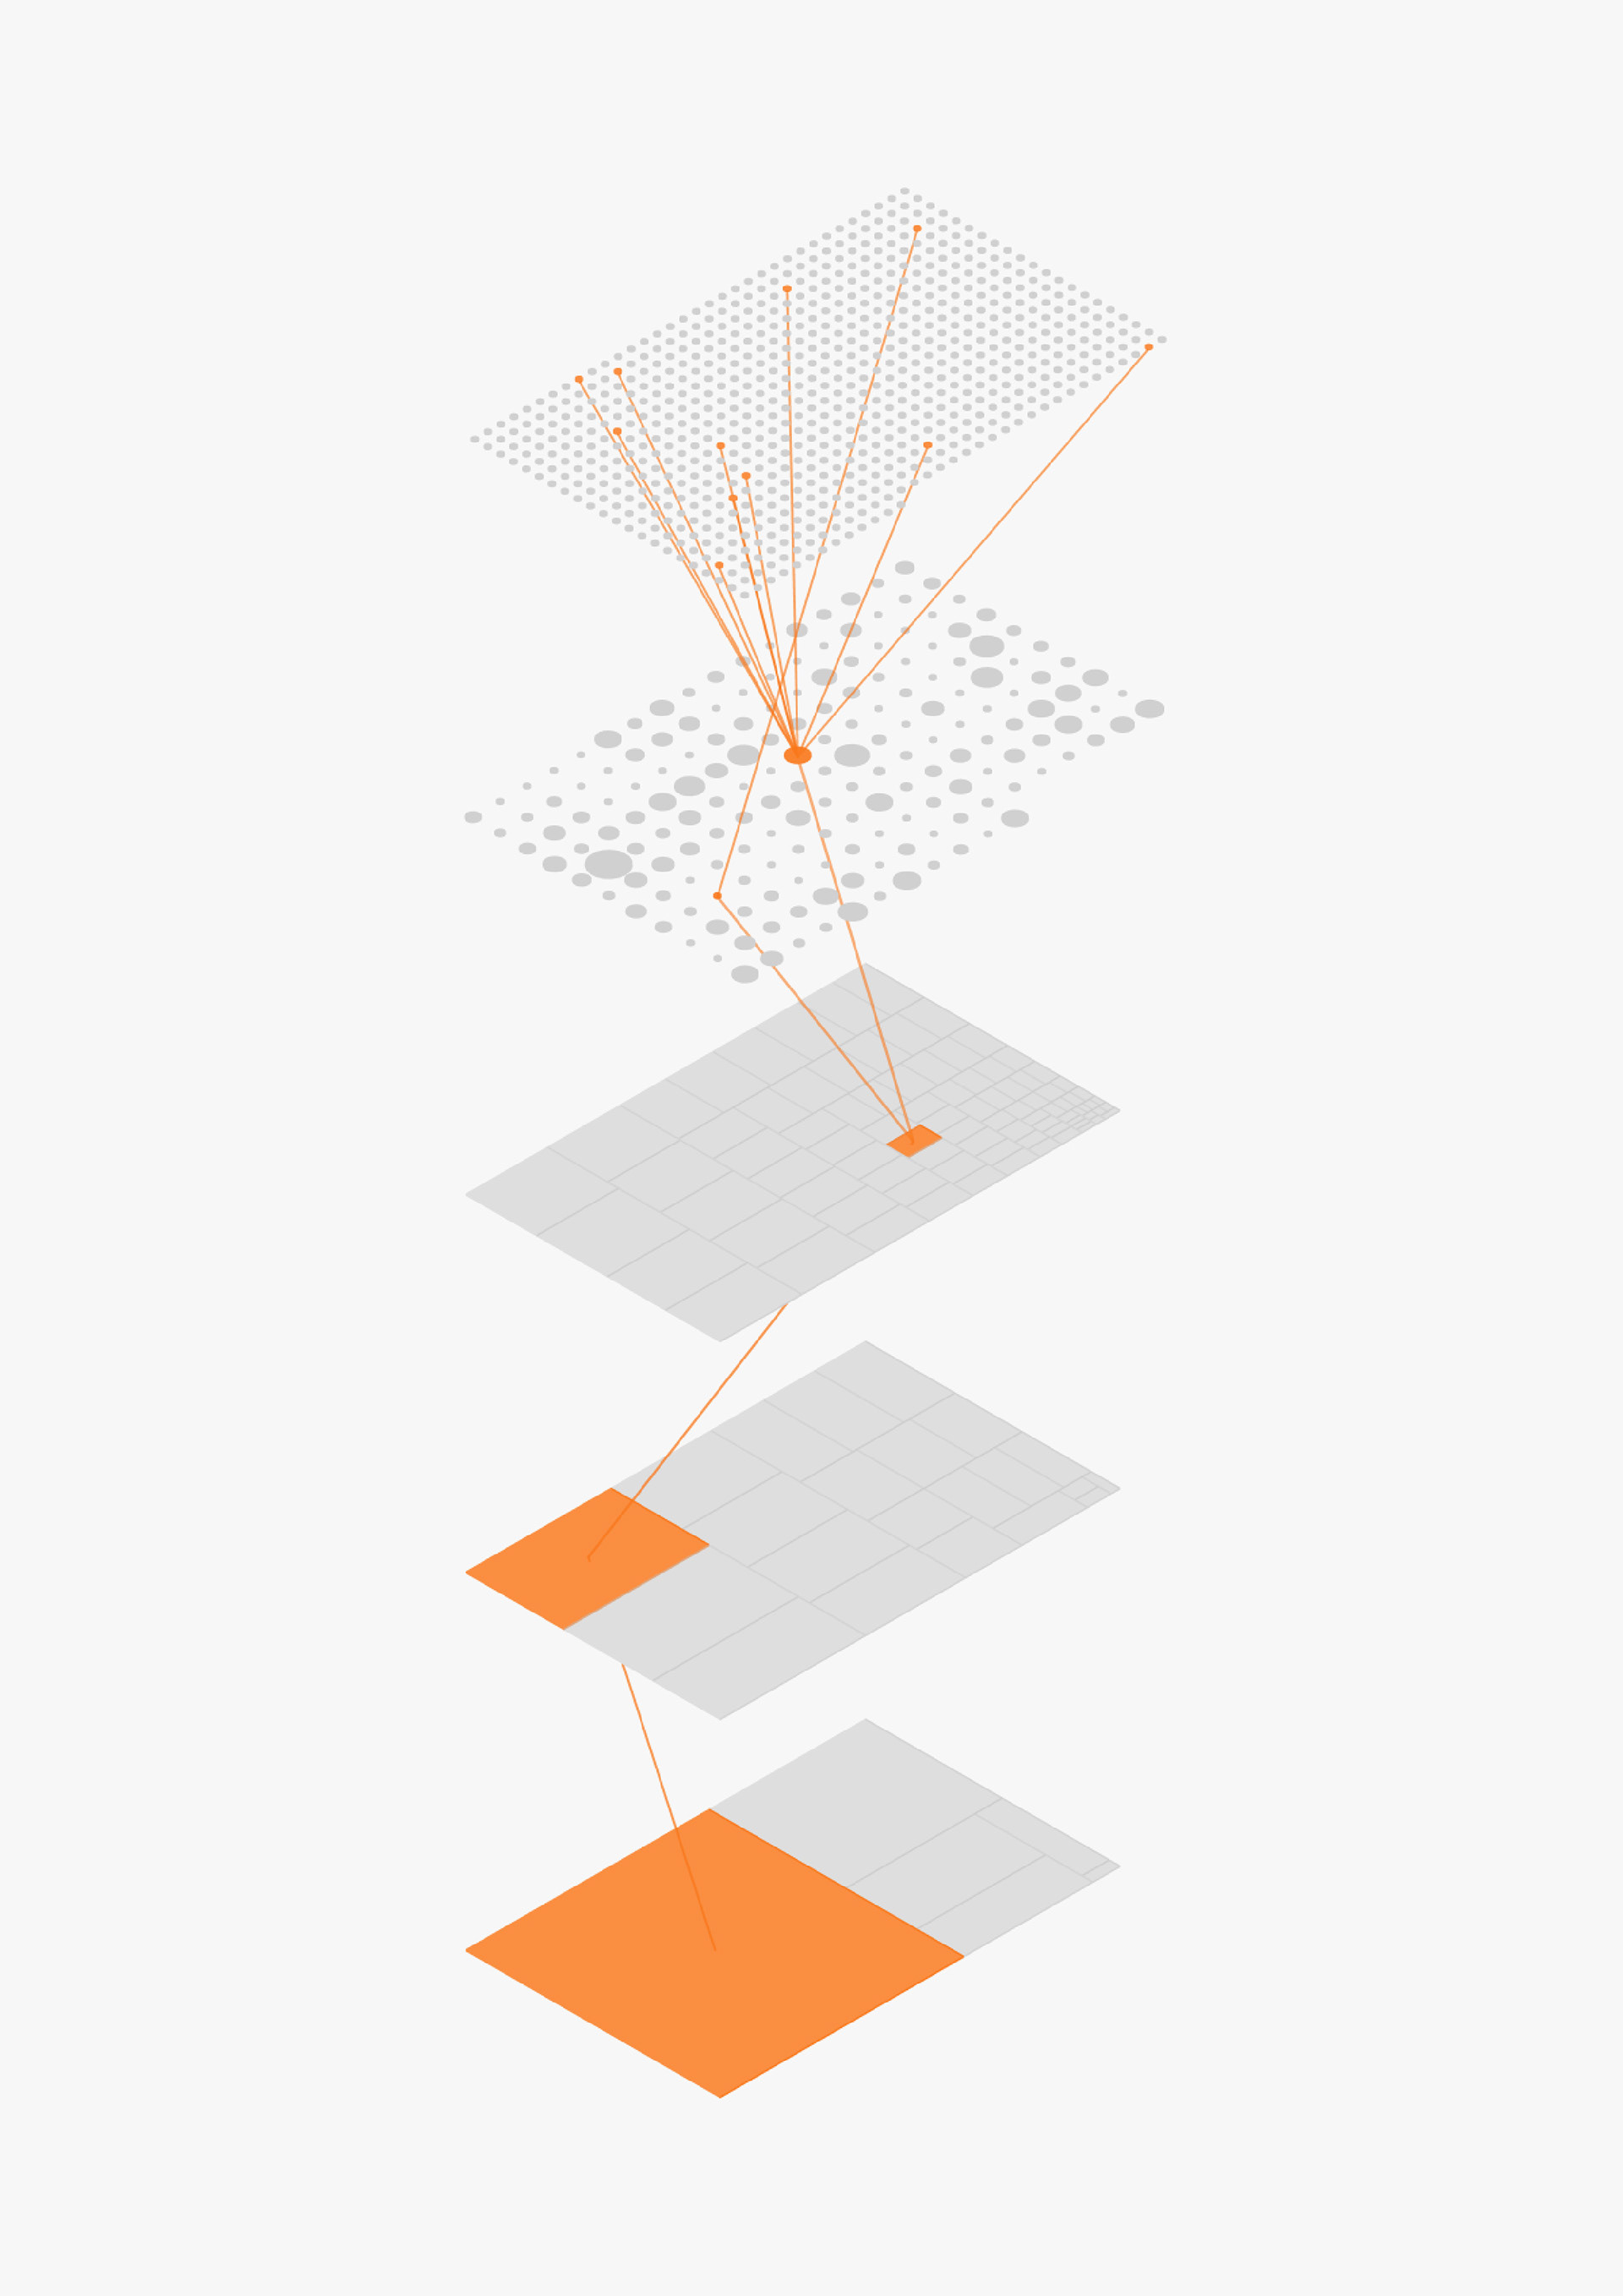
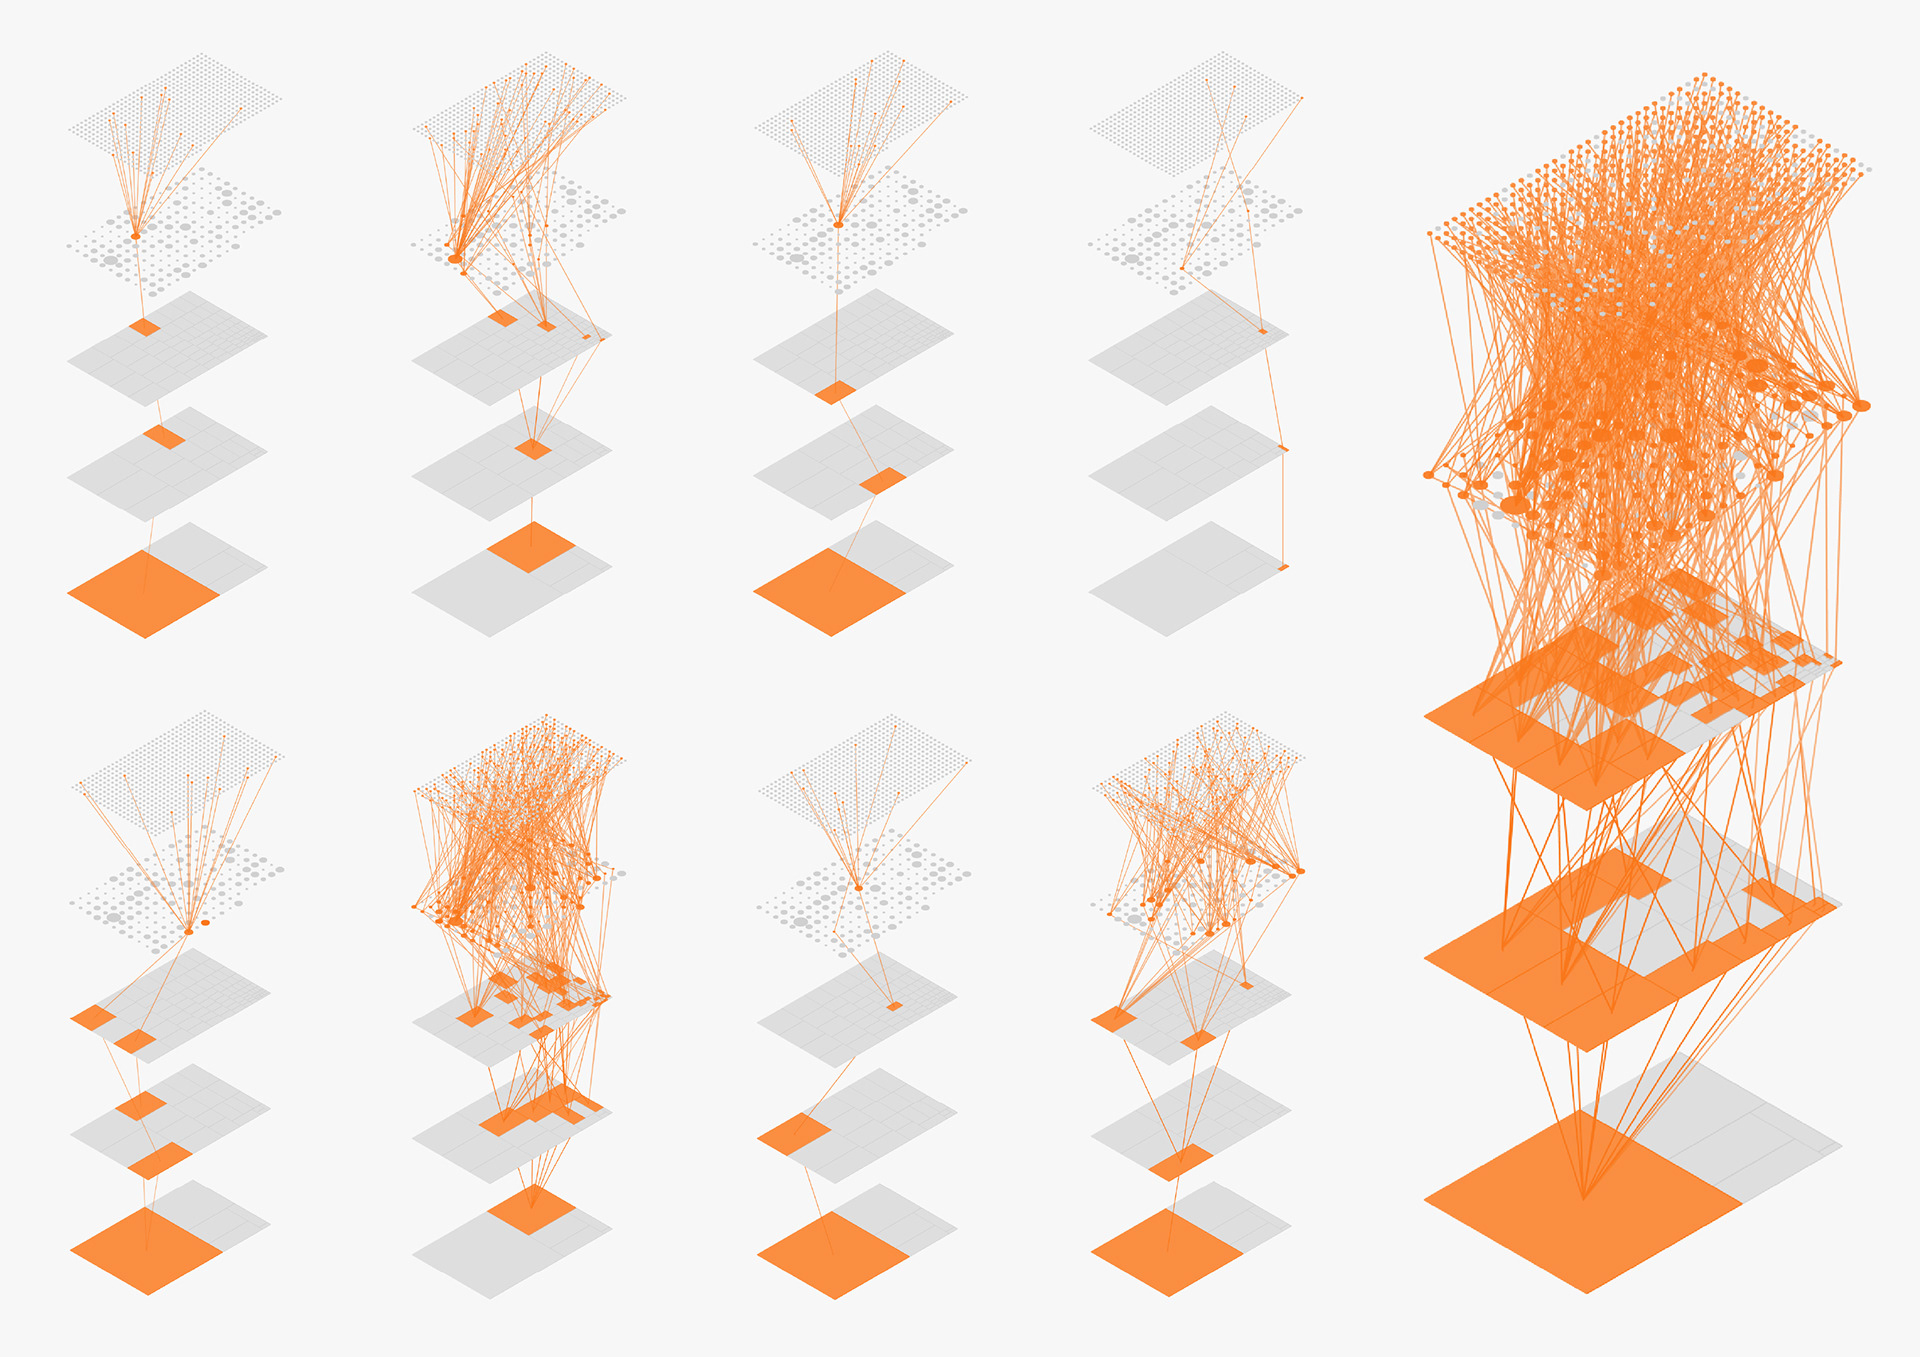
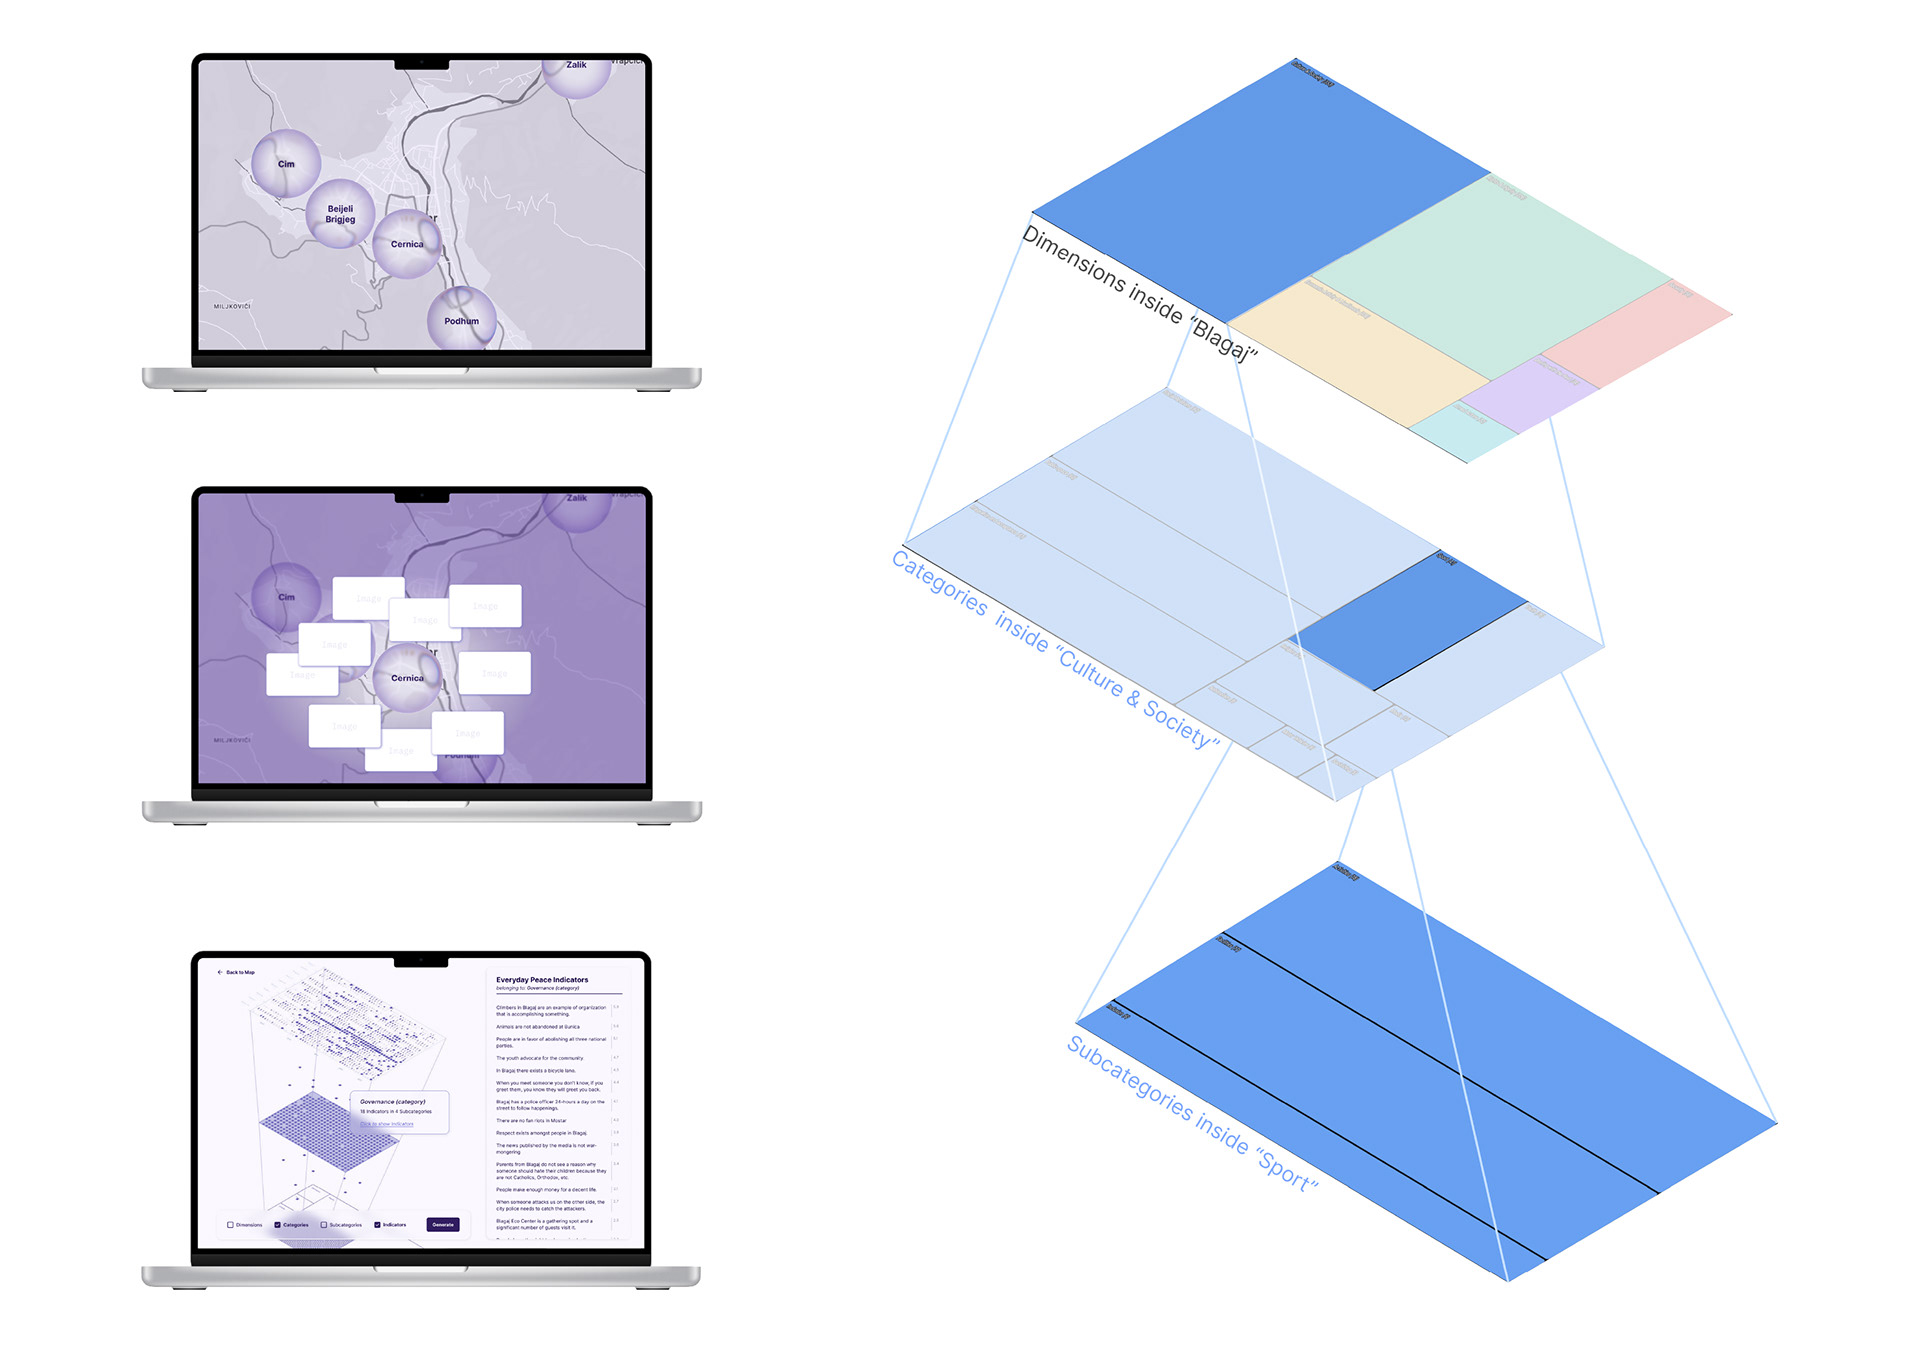
Different states of the data visualization.
The visualization changes depending on what is clicked.
The visualization changes depending on what is clicked.
Progress pictures
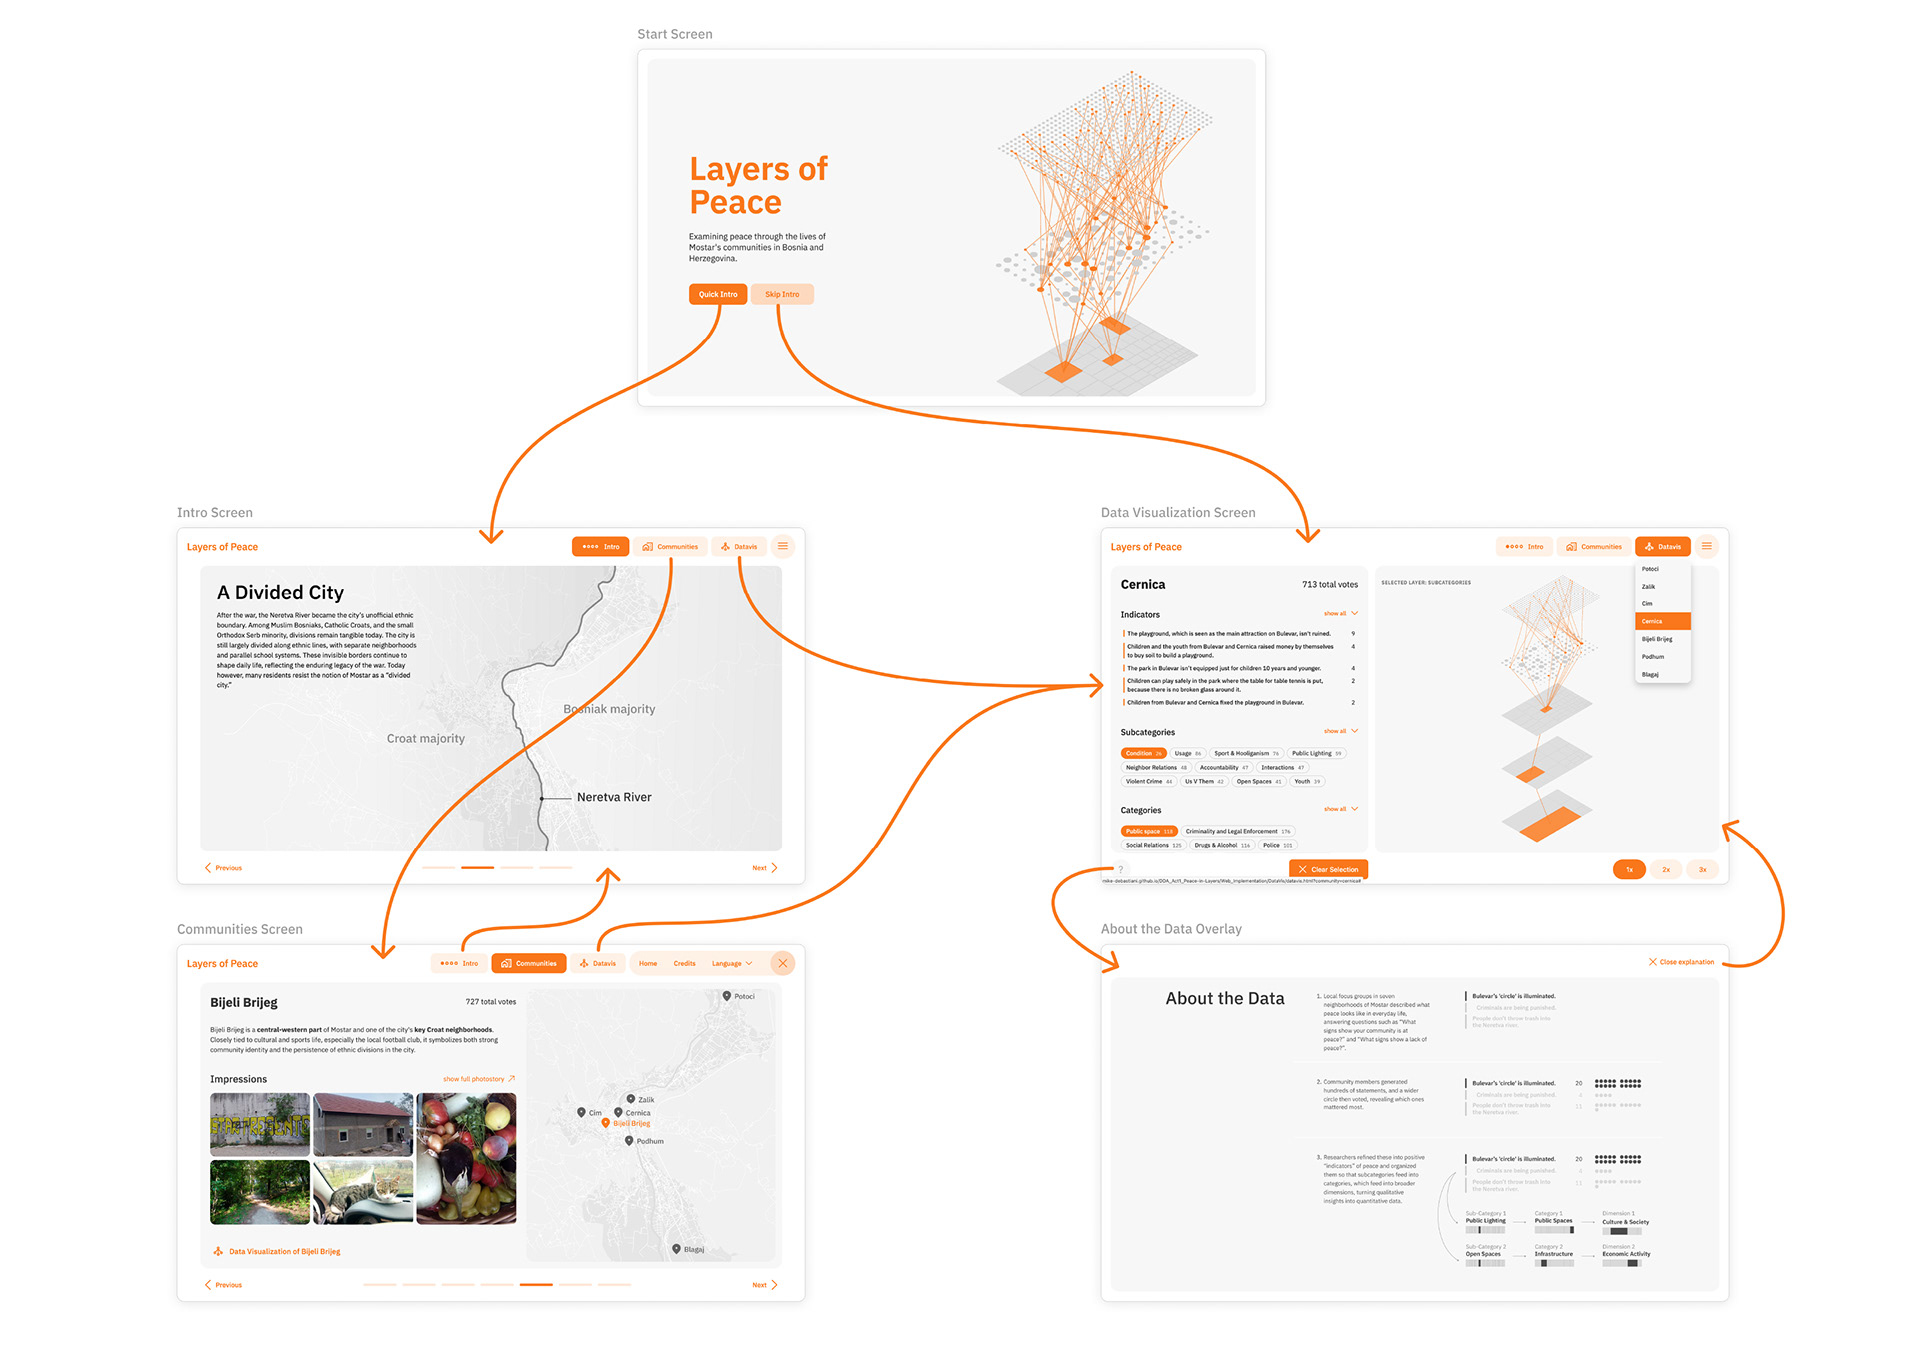
Figma connections
First try in code
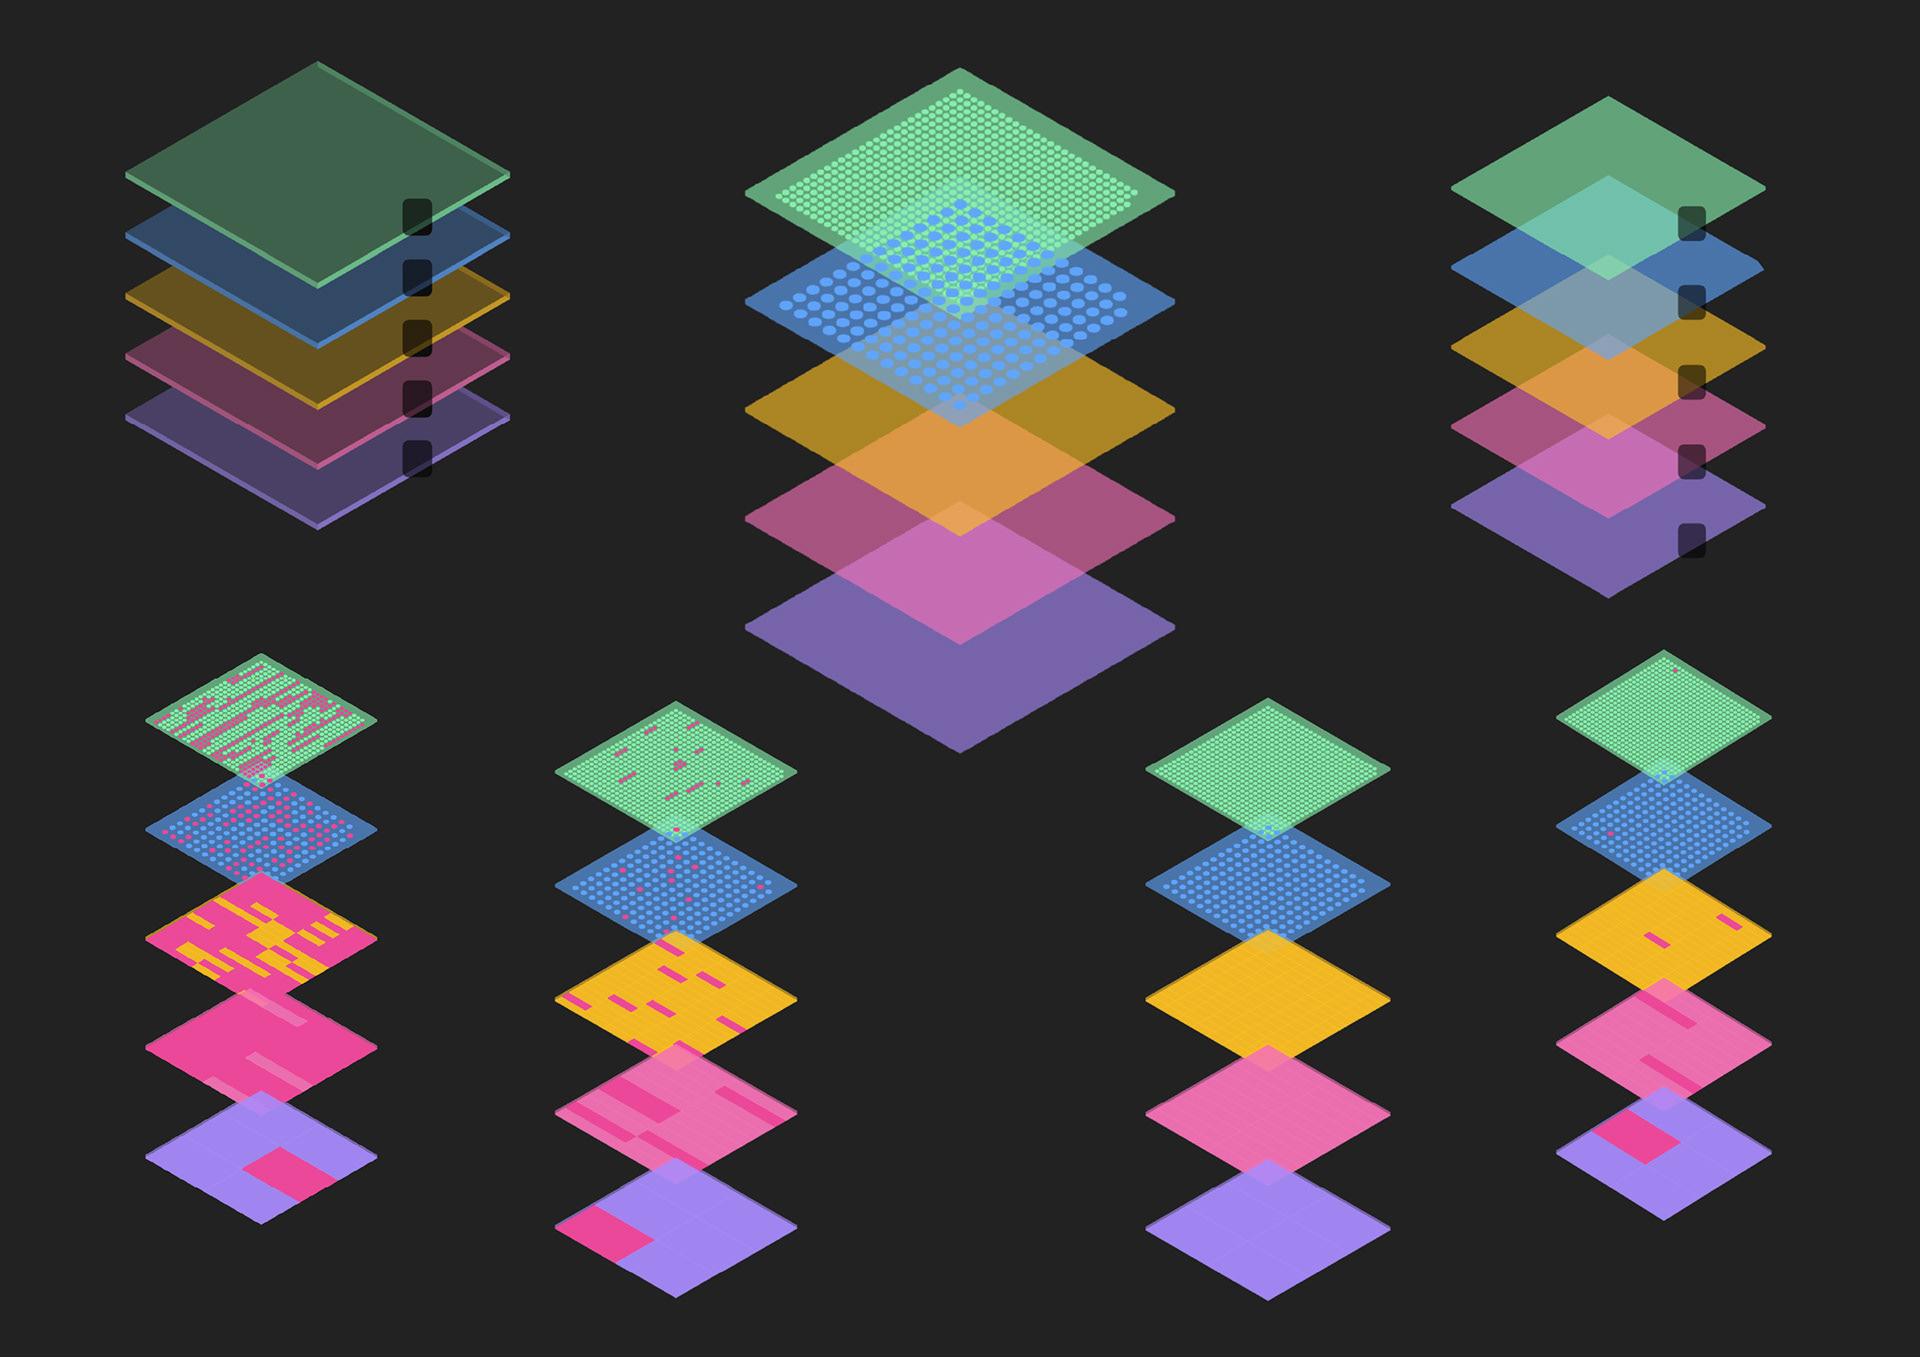
Different versions of the visualisation
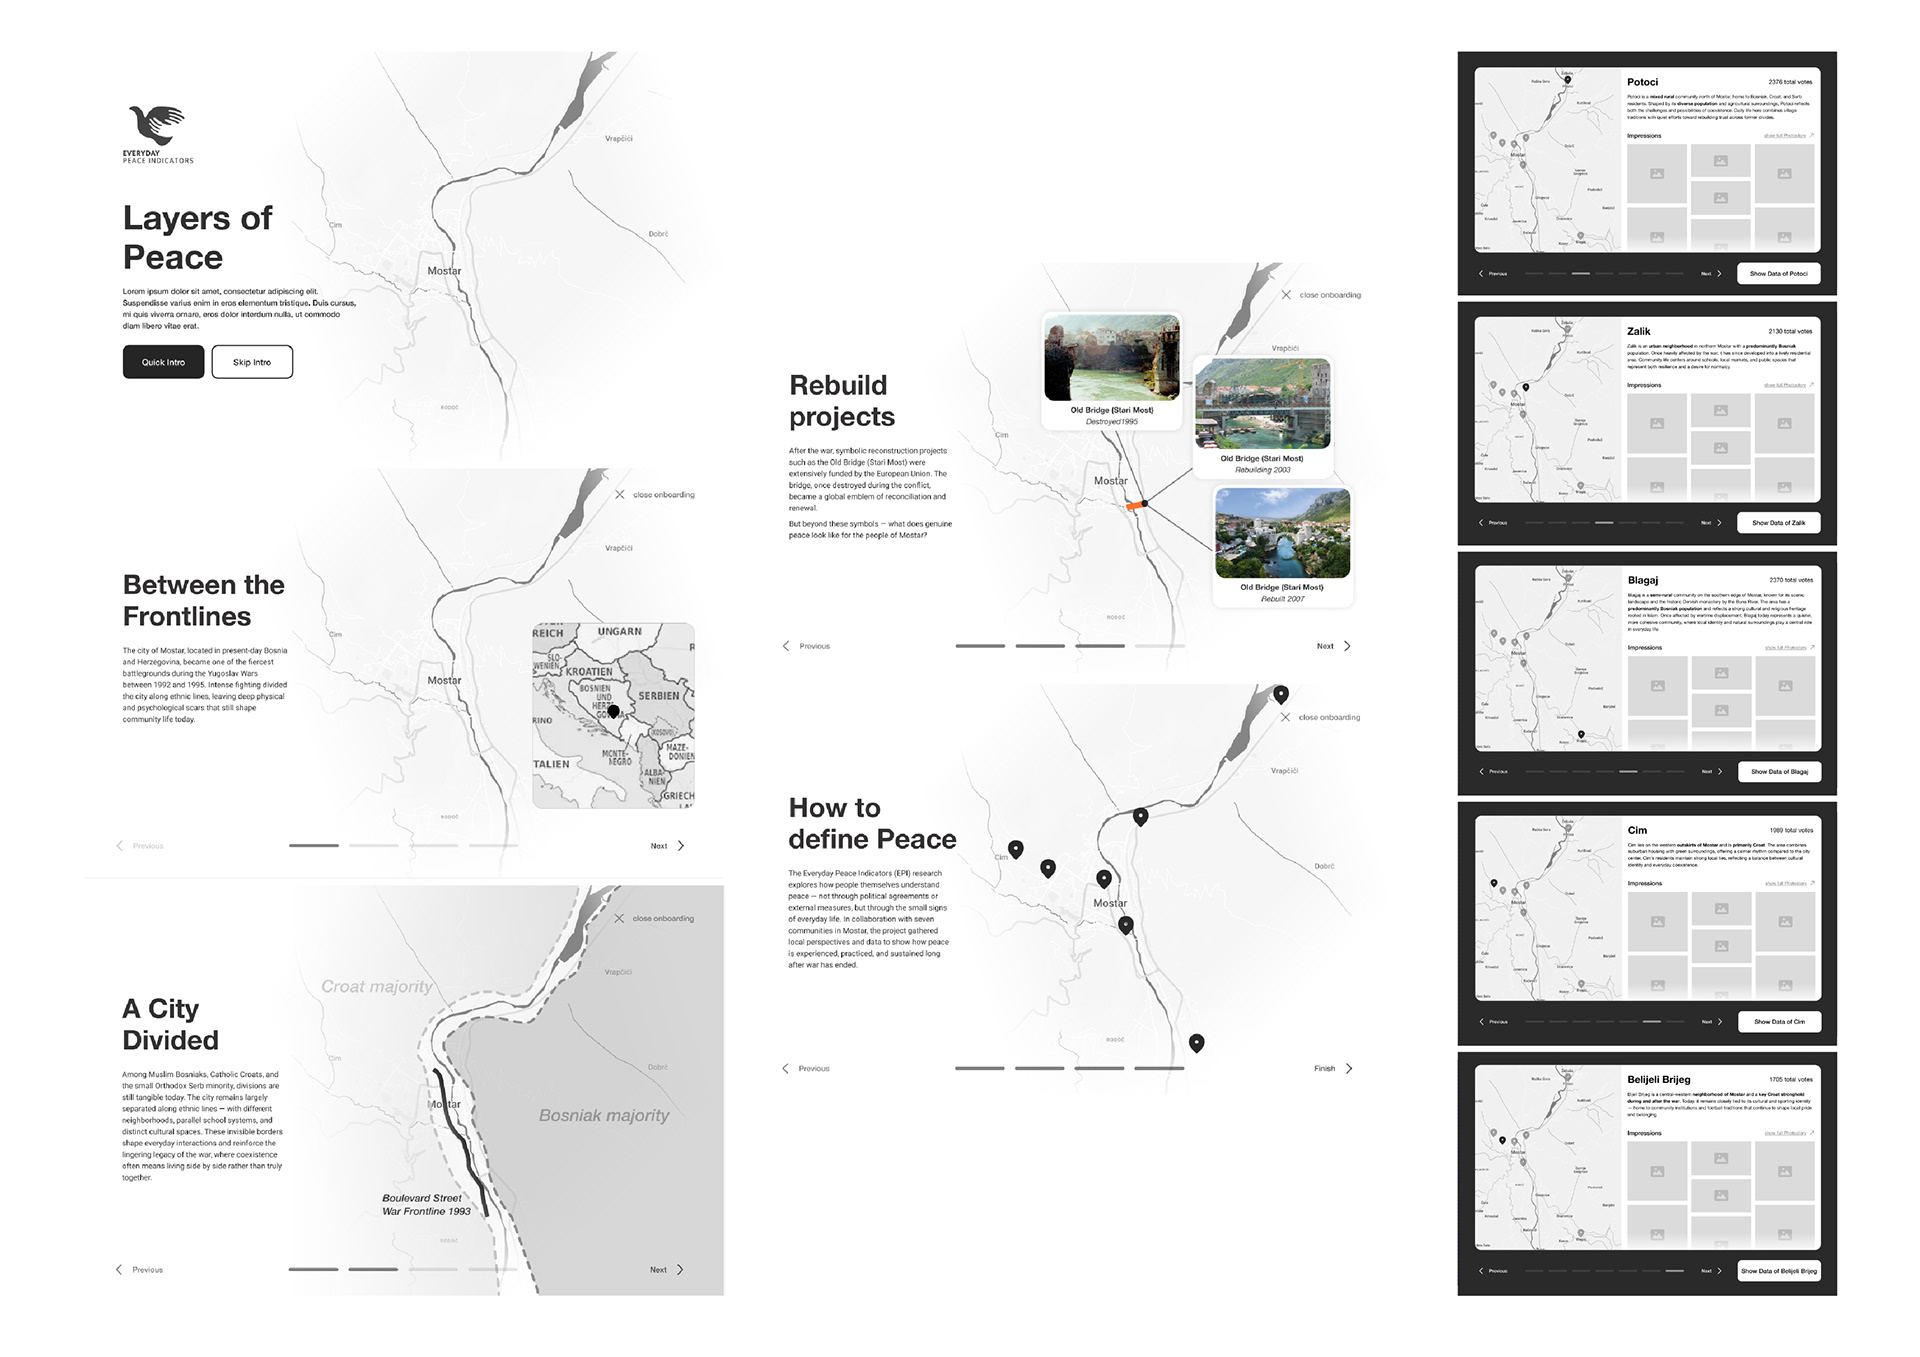
First onboarding
Base Idea
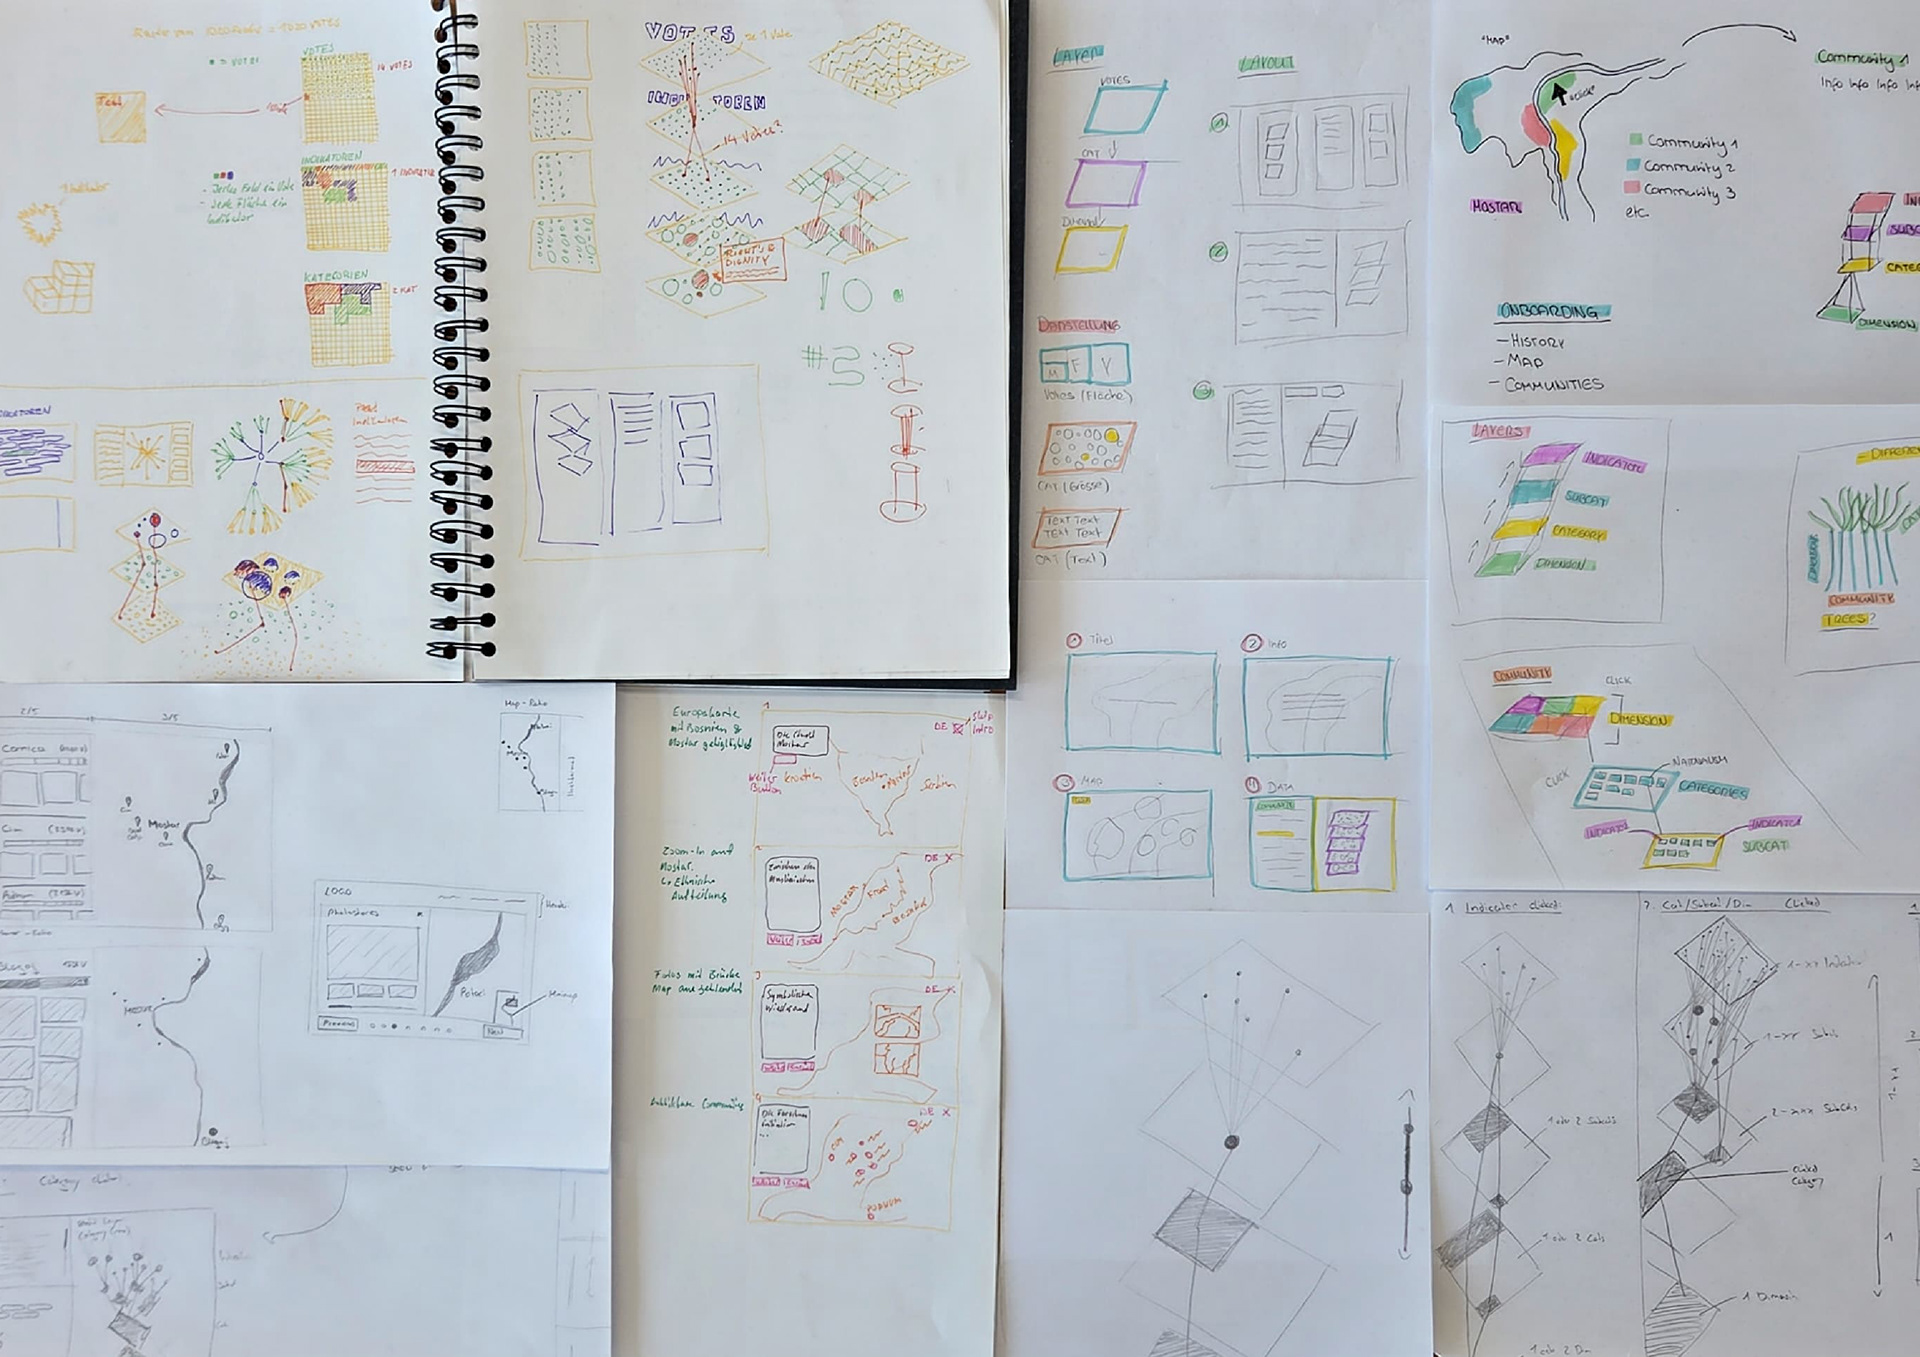
Sketches
Studierende: Danielle Urech, Laurent Steck, Mike De Bastiani
Dozierende: Alain Leclerc von Bonin Michael Flückiger, Hanna Züllig,
Interactive Things
BA Data Design + Art,
Hochschule Luzern - Design Film Kunst
© HSLU, 2025